All SuperEdit commands are described according to the main menu structure. Most SuperEdit commands that are available in the main menu, can be accessed as well from Main, Raster and Vector toolbars or from right-click pop-up menus: Drawing Window menu (DWM) and Composite Document Menu (CDM).
The New command is used to create a new empty composite document. Subdocuments (raster and vector drawings) can be added to such document using the Composite Document dialog activated by the Image Properties… option on Document menu, or by CDM Add Subdocument / Add New Vector options for empty root node.
The Open command is used for selection of a composite document or a single image file to be opened by SuperEdit. In the dialog box launched by the Open command you can choose desired file location, name and format.
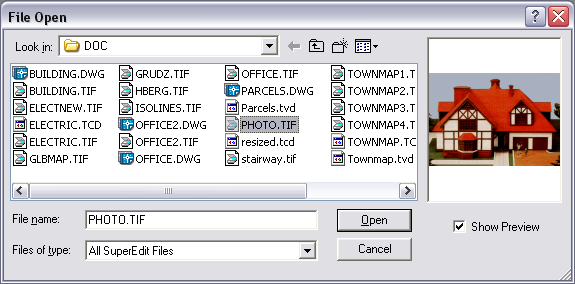
The file preview is displayed if you select file in format supported by SuperEdit (e.g. raster image, TCD, TVD). You can choose (with a Show Preview check-box) whether or not to show the preview. While a preview is being prepared, a progress of that operation is shown in the dialog-box. However, if the preparation of preview does not take much time, progress does not even appear on the dialog window. After preview has been put in its window, the progress window (if it was visible in the meantime) is being hidden.
You can take any action concerning to the FileOpen dialog, while a preview is being prepared. Any of the controls can be clicked and the appropriate action follows.
That means, that for example you can:
change file selection or directory (preview of new selected file will begin to prepare from the very beginning),
click Cancel (leaving dialog at once),
click OK (accepting the selected file to open).
Set appropriate directory, choose desired file format type, and highlight the file name on the list or type-in its name into edit box. Click the Open button or double-click the file name on the list to open it.
When you select a single raster image or vector drawing file for opening, SuperEdit opens this file without creating a TCD structure for it. If you want SuperEdit to create a new composite document that contains a reference to the single drawing just opened, use the Document – Switch to TCD Mode option. SuperEdit embeds the opened file with the TCD structure and opens TCD Contents window to show the structure. Usethe Document – Switch to Image Mode option to go back to single drawing mode.
The Close command terminates session with the currently opened composite document by closing the file with its contents. If the document has been modified during the SuperEdit session, the user is asked to decide whether to save the changes. If positive, the document will be saved in the same file from which it has been loaded (opened). With new document opened, SuperEdit asks to give it a name. The save operation will be performed on all subdocuments that have been modified in the session. If some new vector drawings have been added, the user is asked to give them new name. If any of raster subdocuments before opening did not have associated TAF file, the user is asked for saving as well, in order that default TAF file could be created.
The Save command saves the changes made to the current composite document in the same file from which the document has been loaded (opened). At the same time changes made to all subdocuments are also saved, i.e. written to their respective files and their associated TAF or RLD files (see description of the Open tab of the Configuration dialog for details). If you are working with a single imagefile,the changes are saved to the file without saving the temporary TCD document. SuperEdit saves views created during single-drawing session (see the description of the Views Manager command) in the file with the same name as the single drawing and the TCV extension.
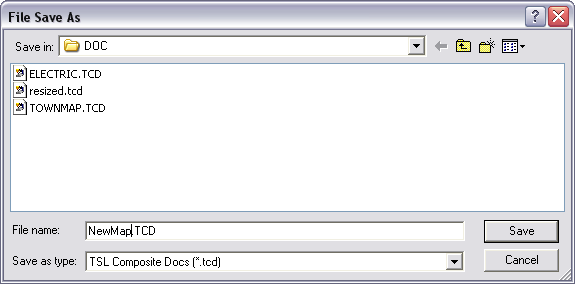
The Save As... command saves the current contents of the simple or TCD document in a file different from which that document has been loaded. In the dialog box launched by the Save As... command you can choose a desired file location, name and format.
The Save As... command also saves the current contents of all subdocuments, in a way that depends on the configuration option Copy subdocs while Saving As... TCD file (see the Save tab on Configuration dialog). When the Copy subdocs... option is checked, the Save As... command automatically executes the Save As... command for each subdocument, too – giving the user a possibility of creating new separate copies of subdocuments that belong to the newly created composite document.
When the Copy subdocs... option is not checked, the Save As... command automatically executes the Save command for each subdocument that has been modified during the session. The newly created composite document will be linked to the same subdocument files as its ancestor.
If you are working with a single imagefile, Save As... command saves the contents of the currently opened image in a different file of the same format.
If the file with the entered name exists, the program launches additional message box that asks you if you want to overwrite the existing file.
The rules of creating TAF and TCV files by the Save As... command are the same as those concerning the Save command (see the description of Save command).
The Convert command changes the format of raster data. A dialog box named File(s) to Convert, otherwise identical to the dialog box in the Open command, is launched for selecting the files to be converted. A similar dialog box Destination File(s) is used for selecting a new image format, file name and destination (disk drive and directory). If the newly selected file format supports multiple compression modes, an additional dialog box appears for precise selection of a desired file sub-format.

The list of output file formats and compression modes depends on the format of the converted (input) file. The full list of formats that are available in each case is displayed in the File Type list box.

When multiple input files are selected, they are converted to separate destination files with names taken from the input files and with the same common extension selected by the user for the whole group. This may be changed by setting the ConvertToOneFile parameter in the supered.ini file to 1 (see the section called “SUPERED.INI file” for the parameter's description), so that a single destination file in one of multi-page formats (TIFF, DCX) will be created. Each page in the resulting document will contain data from the corresponding input file.
Use Split Raster command to split a single raster file to a specified number of raster files and make them subdocuments of one TCD document.
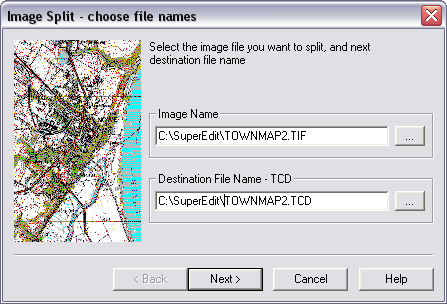
The command launches the Choose file names dialog. Enter a name of the file you want to split and the name of final TCD document containing all parts of the split file as subdocuments. Click Next button to display the Set split parametersdialog.
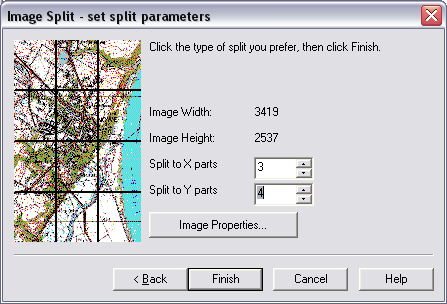
Enter numbers that define the way the original raster file will be split. The preview window shows appropriate splitting lines graphically. Use Image Properties... button to check properties of the split image. Click Finish button to start splitting procedure.
To print a document use the File - Print option or click the Print button on the Main toolbar. It starts printing of the drawing(s) on the active printing device according to the parameters that are set in the Print Preview option. Printing process is divided in two phases:
1. Preparing data for the Print Manager program. During this phase, a window Printing from <document name> is displayed with two numbers: the percentage of filling the internal program data buffer and the percentage of sending the data to the Print Manager. This progress window has also the Cancel button. Pressing this button cancels printing and is the only action available to the user in this phase of printing.
Transferring the data from the Print Manager to a printer or plotter. During this phase, it is already possible to work with SuperEdit. When the Print Manager is turned off (in the Control Panel) SuperEdit sends the data to a printer/plotter directly.
Drawings printed without printing template use the smallest possible palette type. For example mono drawings are printed as mono ones, 16-color drawings use 16-color palette type. Due to that feature, these kind of documents are printed quicker (not in 256 colors, as it has used to be in previous versions of SuperEdit).
To start the Print preview function, click its button in the Main toolbar.
A paper sheet with print window and margins is displayed (the print window is a viewport that is used to present the document on a paper sheet). If a printing template is defined (see Print tab on Configuration dialog), it is also displayed. The rest of the window is grayed. You can select the rectangle that defines the print window and edit it like an ordinary rectangle entity. The only difference is that changes of rectangle’s extents are accompanied by the corresponding changes of the document’s area that is displayed inside it. Dragging the rectangle around moves its contents, too.

A new group of items is added to the Drawing Window Menu (DWM).

With empty selection, the additional group consists of the following items:
Print window – it enters the Define print window action, described below;
Print setup – it enters standard Print setup dialog;
Page setup – it enters the Margins dialog where you can examine and/or edit values of left, right, top and bottom margins and choose units they are defined (a units change affects mouse coordinates that are reported in the status bar);
Portrait / Landscape – use it to change the orientation in the printing template;
Print – use it to start printing;
Publish HTML – use it to produce the HTML file (*.html, *.htm); the standard Save As dialog lets you choose a file name (see the next paragraph for HTML publishing details);
Exit Preview – use it to finish Print Preview actions.

When the print window rectangle is selected, the additional group consists of the following items:
Print frame - use it to print the frame of print window on the paper sheet;
Hide image - use it to switch off the image of the document from the paper sheet;
Set Print Document - use it to set the document you want to print; you can choose a document file with the standard File Open dialog that is displayed.
SuperEdit can save the printout in HTML format. Enter Print Preview command and select DWM Publish HTML option. SuperEdit will ask for HTML file name for preview page. It will automatically create additional files containing preview image, full resolution image and pages suitable for printout.
The preview HTML page can be created from a template. The template is an ordinary HTML file, which can be created with any suitable HTML editor. It should contain special codes that will be replaced during execution of the Publish HTML command.
$$PreviewGIF$$ - will be replaced by a file name of the preview image
$$PreviewHTML-96$$ - will be replaced by a file name of the HTML page suitable for printing (when the user uses small screen fonts)
$$PreviewHTML-120$$ - will be replaced by a file name of the HTML page suitable for printing (when the user uses large screen fonts)
For successful printing HTML check for proper margins. Right click on document in Print preview window and select Margins setup. In Margins dialog set margins to 1 cm or more. Now if you want to print HTML document from your Web Browser select Print Setup and set margins for values you set in SuperEdit or a little bit more.
Printing to HTML has been tested with Microsoft Internet Explorer 4.0 and Netscape Navigator 4.06.
A print window is a viewport that is used to present the document on a paper sheet. The Print Window option lets you define a rectangular area of the document that is to be shown in the print window and a scale that is used to present that area.
To start the Print Window function, use the option in File menu or click its button in Main toolbar. A rectangle with markers at its corners is displayed. Now you can:
change the position by dragging the whole rectangle – the scale remains constant;
change the scale by dragging the markers in the corners of the rectangle.

To examine and/or edit the scale used to present the document in print window click the right mouse button.

The pop-up menu that is displayed consists of the following items:
Accept - use it to confirm the current scale;
Cancel - use it to discard changes made;
Five subsequent items allow setting a scale. The proposed scales’ values are based on the current scale that is defined by the current printing window size. This scale is accompanied with two items with shrinking scales above and two items with enlarging scales below the current one. If you choose a new current scale from the displayed scale values, the size of the printing window is adjusted accordingly and the scope of available scales is moved in the appropriate direction. You can use the right mouse click again to continue adjusting the printing scale.
Fit - the proposed scale fits the whole document in the printing window;
User - the proposed scale is the last chosen scale (initially the fitted scale);
Select... - lets you type in a new value of printing scale.
The first two items end the Print Window function and enter the Print Preview mode.
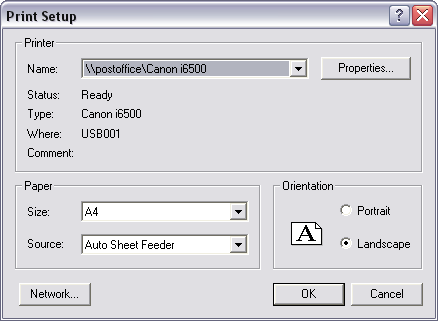
To enter the Print Setup function, click its button in the Main toolbar. The Print Setup dialog box lets you do the following:
select the current print device from the list of available devices;
change some printer parameters (e.g. print orientation, paper size, paper source);
set print quality parameters in the Properties dialog box, which is displayed after pressing the Properties button.
New printer drivers can be added and printer to port mappings can be changed using the MS Windows system Control Panel.
The Scan command is used to start scanning of a new document. Depending on the kind of scanned document (single-page or multiple-page) one of two options can be selected:
One page;
Multiple pages.
Before scanning, it is necessary to select a file name and a raster format of the drawing that will be created as a result of scanning. After scanning, a new composite document is created, containing a single raster file with the scanned image.
This command starts scanning of a single-page document.
Depending on the type of the selected scanner it may be necessary to start scanning physically, e.g. by pressing a button on the scanner. Some scanners can start scanning automatically; others can display their proprietary window with information about scanning progress. The scanned document is then displayed in a window labeled with a temporary name, e.g. SCAN_1.
This command starts scanning of a multiple-page document.
The process of multiple-page scanning is similar to the single-page scanning. After each page the dialog box appears and informs about the number of pages scanned so far. Four buttons are available (some of them can be disabled, depending on the situation):
Next - confirms the last scanned page and starts scanning of the next one;
The Same - repeats scanning of the last page;
Close - confirms the last scanned page and stops scanning; the file will contain the number of pages as currently displayed in the dialog box;
Cancel - stops scanning and discards pages scanned so far.
The first page of the scanned document is displayed in a window labeled with a temporary name, e.g. SCAN_1.
The Select Source command is used for selection of the current scanning device (see the Scan command). The Select Source command is relevant only when more then one scanner is installed.

Click a name and press the Select button to choose a scanning device. Particular scanning parameters can be set using the Scan Parameters command in the Options menu. The list shows only TWAIN-compatible devices that have been properly installed. When the part of scanning software that is responsible for cooperation with applications that use the TWAIN standard is present, the device should appear on the list of available scanners (no additional SuperEdit installation procedure is required).

The Undo command is active only when there are some unsaved changes made to the current Tessel Composite Document. The Undo command cancels the changes made in the last step of editing. If there are several unsaved steps of editing, the maximal number of available Undo steps is defined by the MaxUndoSteps parameter in the supered.ini file (see the section called “SUPERED.INI file” for the description of supered.ini file).
To cancel all changes made to the composite document and its subdocuments, close it without saving and reopen the same document.
The Redo command is active only when there are some changes made to the current Tessel Composite Document that have been previously cancelled using the Undo command. The Redo command brings those changes back. If the Undo command has been issued several times, the Redo command can be issued the same number of times, moving one step forward each time.
The Copy Image command is used to send a copy of the current document to the MS Windows system Clipboard. It is used for simple interchange of documents between different MS Windows applications.
The Copy Image command prepares data from the whole document, no matter what the current view is. It is also possible to define sizes and resolution for preparing a copy of the document. Four variables are used for this purpose, Width, Height, Xres and Yres, all with the ClipboardCopy prefix defined in the TSLRVC Library Settings section of the supered.ini file. Editing this file can change all these parameters. New values are used next time the program is run.
The default settings of variables result in making a copy of a document that is 6.67 inches wide and 5 inches high with 96 dots per inch resolution. These parameters reflect the size and resolution of a typical monitor screen. A document will be scaled in such a way that it will cover the demanded area as fully as possible. A document can be copied in every available format (embedded object, link, bitmaps and metafile).
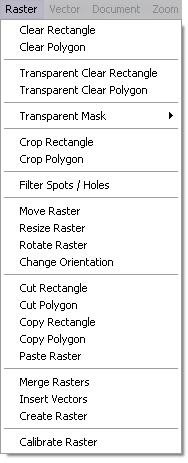
The Clear rectangle command allows you to clear rectangular areas in raster image. You may clear several areas at once, defining rectangles on several selected drawings. Monochrome drawings are cleared to white background. For color images, there is a need to specify which color should be used to fill the hole in the raster after clear operation. The intuitive white is not proper for the most of color images. The user can define the best fill color using the Options – Fill Color... function.
After issuing the Clear rectangle command, point and click the left mouse button to define opposite vertices of the rectangle. Repeat the action if you want to clear more then one rectangular area of raster drawing. To finish defining rectangles and execute clearing, use the OTM Accept option. Use the OTM Cancel option instead, if you want to discard whole operation.
During defining each rectangle, you may use the OTM Reject option if you want to withdraw the current rectangle being defined and start to define it again. Before final acceptance, you may drag vertices of the rectangles defined previously to correct them; use the OTM Delete option to delete the previously defined rectangle. The latter option is accessible only if you call OTM using right click while the cursor is over edge of some rectangle. You may observe hints displayed in the Status bar that tell you about details of your current possibilities.
The Clear polygon command allows you to clear polygon areas in raster image. You may clear several areas at once, defining polygons on several selected drawings. Monochrome drawings are cleared to white background. For color images, there is a need to specify which color should be used to fill the hole in the raster after clear operation. The intuitive white is not proper for the most of color images. The user can define the best fill color using the Options – Fill Color... function.
After issuing the Clear polygon command, point and click the left mouse button to define subsequent vertices of the polygon. Use the OTM End polygon option to finish defining vertices (the point of the right click is not included in the polygon definition). Repeat the action if you want to clear more then one polygonal area of raster drawing. To finish defining polygons and execute clearing, use the OTM Accept option. Use the OTM Cancel option instead, if you want to discard whole operation.
During defining each polygon, you may use the OTM Reject option if you want to withdraw the current polygon being defined and start to define it again. Before final acceptance, you may drag vertices of the polygons defined previously to correct them. Use the OTM Add Vertex / Delete Vertex options pointing where appropriate to add or delete vertices. Use the OTM Delete option to delete the previously defined polygon. The latter options are accessible only if you call OTM using right click while the cursor is over some polygon’s vertex or its edge, appropriately. You may observe hints displayed in Status bar that tell you about details of your current possibilities.
The Transparent Clear Rectangle command allows you to clear specified colors within any number of rectangles. You can define rectangles in the way you do it in the ordinary Clear Rectangle command. You can choose colors for clearing in Transparent Color Filter dialog. It is invoked by Options – Transparent Colors command.
The choosen colors define a transparent mask. You can work with it only if there are rasters of True Color type and TIFF format selected.
You can enable / disable transparent viewing with changing the check-box Enable image transparency state in the Options - Configuration - View dialog.
The Transparent Clear Polygon command allows you to clear specified colors within any number of poygons. You can define polygons in the way you do it in the ordinary Clear polygon command. You can choose colors for clearing in Transparent Color Filter dialog. It is invoked by Options – Transparent Colors command.
The choosen colors define a transparent mask. You can work with it only if there are rasters of True Color type and TIFF format selected.
You can enable / disable transparent viewing with changing the check-box Enable image transparency state in the Options - Configuration - View dialog.
It is possible to choose from Transparent Color Filter dialog that is invoked by Options/Transparent Colors command the colors, which are to be cleared within the chosen area. These colors define the transparent mask. You can work with it only if there are rasters of True Color type and TIFF format selected.
You can can invert the actual transparent mask of the selected drawing (Raster - Transparent Mask - Invert) or remove it (Raster - Transparent Mask - Remove Invert).
You can enable / disable transparent viewing with changing the check-box Enable image transparency state in the Options - Configuration - View dialog.
Transparent masks introduced in color drawing are transformed properly in Resize / Rotate / Calibrate operations and preserved in Cut / Copy / Paste operations.
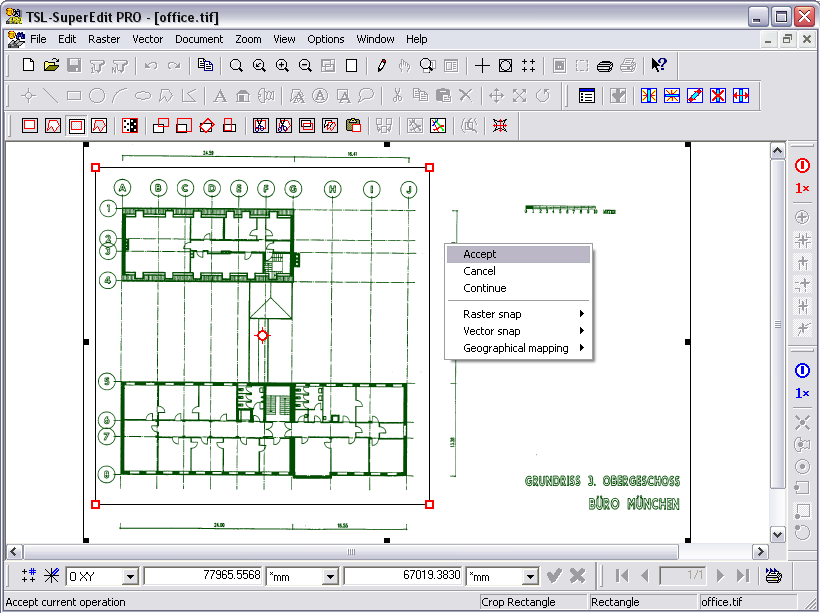
The Crop rectangle command allows you to crop raster image or enlarge its extents, depending on the former size and the size and shape of the cropping rectangle. Use it to clear unwanted outer parts of raster image of regular shape or to enlarge image extent. You may crop or extent several selected drawings at once, monochrome or color ones, to the common rectangular frame.
After issuing the Crop rectangle command, point and click the left mouse button to define opposite vertices of the rectangle. Use the OTM Accept option to execute cropping. Use the OTM Cancel option instead, if you want to discard whole operation.
Before final acceptance, you may use the OTM Continue option if you want to correct the shape of the rectangle by dragging its corners. Instead, you may delete the rectangle using the OTM Delete option with the cursor placed over the edge of the rectangle, and start to define it from the beginning.
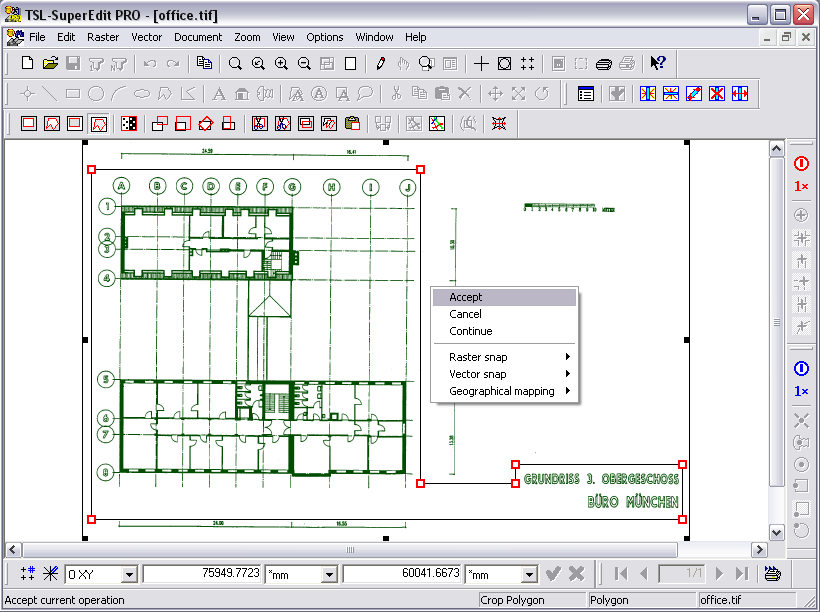
The Crop polygon command allows you to crop raster image to the common part of image’s former extents and the extent of given cropping polygon. Use it to clear unwanted outer parts of raster image of irregular shape. You may crop several selected drawings at once, monochrome or color ones, each to separate parts that result from cutting the polygon by former drawing’s frame.
After issuing the Crop polygon command, point and click the left mouse button to define subsequent vertices of the polygon. Use the OTM End polygon option to finish defining vertices (the point of the right click is not included in the polygon definition). Use the OTM Accept option to execute cropping. Use the OTM Cancel option instead, if you want to discard whole operation.
Before final acceptance, you may use the OTM Continue option if you want to correct the shape of the polygon by dragging, or add / delete its vertices. Instead, you may delete the polygon using the OTM Delete option with the cursor placed over the edge of the polygon, and start to define it from the beginning.
The Filter spots / holes command allows you to remove spots or holes from raster image that contain less or equal pixels than defined by the user. You may define maximal spot / hole to remove by selecting sample spot / hole from the raster image or entering maximal spot / hole size by the keyboard. You may remove spots / holes from the whole raster image or defined rectangular area. You may perform filtering on several selected drawings at once. Since color or gray scaled raster drawings cannot be filtered in the way the Filter spots / holes operation works, the command is unavailable if you select raster drawings of that type.
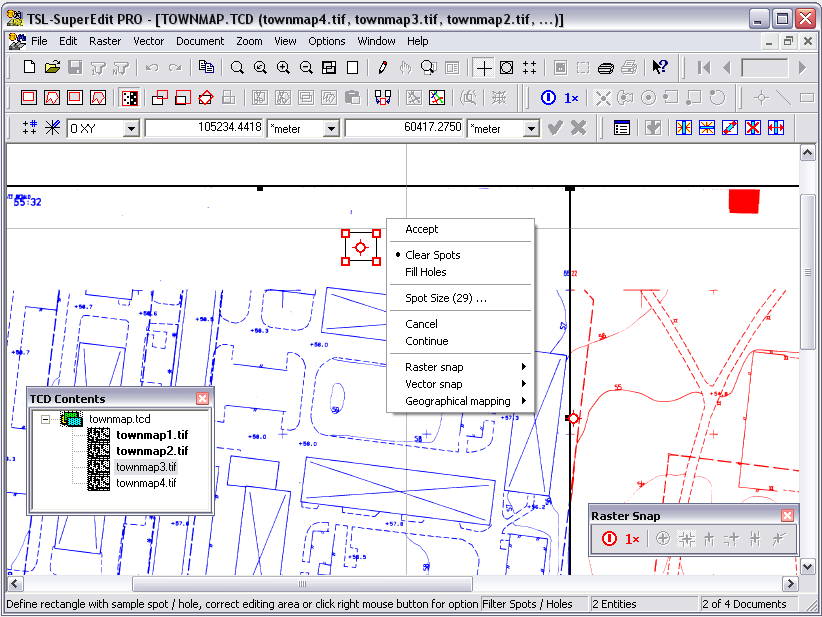
Immediately after entering this option, you may define rectangle area containing sample spot / hole by pointing and clicking two opposite corners of the rectangle. The OTM Spot / Hole size option shows you the size calculated or recently used.
The default area to be affected by this operation is presented as a rectangle taken from single raster drawing extent or covering all raster drawings if more than one has been selected. You may drag its corners if you want to redefine editing area, e.g. when cleaning only some part of the drawing(s).
Choose appropriate OTM Clear spots / Fill holes option if you want to change the way the image is to be filtered.
Choose the OTM Spot / Hole size option if you want to enter spot / hole size numerically in additional Filter Spots / Holes dialog. The spot / hole size is the maximal number of adjacent black / white pixels, isolated from other pixels of the same color, that will be regarded as spot to clear / hole to fill. You may choose the type of filtering operation in the dialog as well.

Use the OTM Accept option to execute filtering. The Drawing window regenerates its content to reflect changes made to raster image. Use the OTM Cancel option instead, if you want to discard whole operation.
Before final acceptance, you may use the OTM Continue option if you want to redefine editing area – or rectangle containing sample spot / hole – by dragging their corners. You may try to examine another sample spot / hole by spanning new rectangle over it; the previous one is automatically deleted and the OTM Spot / Hole size option shows you new value.
Because the spot / hole size and the type of filtering operation is remembered, you do not have to define these parameters if you want to filter a number of subsequent raster images in the same session. Simply call Options and Tools Menu (OTM) just after entering the Filter spots / holes command by right-clicking into Drawing window area, and choose the OTM Accept option without additional activity to perform filtering immediately with the same settings.
The Move raster command is used to move raster image to a new location by moving chosen base point to a new position called target point. You may move several selected drawings at once, monochrome or color ones, together to the new position. Moving raster image does not affect raster data itself; only the insertion point parameter stored in the parameters’ file is changed.
Immediately after entering this option, you may redefine the default position of the base raster point marked as small gray circle with two perpendicular axes (the lower, left frame corner). You may drag the actual base point, marked as small yellow circle connected to the cursor, to desired position and accept it as a new base point by the left mouse click. You may want to choose some raster point, which coordinates have known values. Use the OTM Default option to maintain the default base raster point position.
The drawing frame is still displayed in its original position and a copy of the frame is dragged by its base according to movements of the cursor that takes shape of the moving symbol. Drag the target point marked as small red circle, moving the copy of the frame to desired position, and fix it defining the target point position by the left mouse click.
You may want to enter known coordinates of target point for chosen base raster point numerically. Use Input bar with absolute coordinate system (OXY) activated to enter desired values, as described earlier.
Use the OTM Accept option to execute moving. The Drawing window regenerates its content to reflect the new position of raster image. Use the OTM Cancel option instead, if you want to discard whole operation.
Before final acceptance, each time you may go back and start redefining the command parameters of any phase that you already passed. Go back to defining base point or target point, by choosing the appropriate OTM Base Point / Target Point option (they are accessible only when passed).

The Resize raster command is used to expand or shrink raster image around fixed base point according to a ratio of scaling vector and reference vector. You may resize several selected drawings at once, monochrome or color ones, together to the new size. Do not use the Resize raster command to bring the raster image to a new scale. Redefine the Scale parameter (the scale the raster data are presented) on the Raster Image Properties dialog and then use the Resize raster command to match raster data precisely with actual dimensions. Negative scale factors are not allowed.
Immediately after entering this option, you may redefine the default position of the base raster point marked as small gray circle with two perpendicular axes (the lower, left frame corner). You may drag the actual base point, marked as small yellow circle connected to the cursor, to desired position and accept it as a new base point by the left mouse click. You may want to choose some raster point that corresponds to the start of some reference distance of known value. Use the OTM Default option to maintain the default base raster point position.
Then the default position for a reference vector is displayed as a gray arrow, that starts from the base point just defined, with slope of 45°. You may change the default by dragging the end of the actual reference vector, displayed as an yellow arrow with its end connected to the cursor, to desired position and accept it by the left mouse click. You may want to choose some other raster point that corresponds to the end of some reference distance of known value. Use the OTM Default option to maintain the default reference vector position, for example if you are supposed to enter the scaling factors numerically.
Then the scaling vector is displayed as a red arrow, with its end connected to the cursor, which takes shape of scaling symbol. The drawing frame is still displayed in its original position. Drag the end of the scaling vector, rescaling the copy of the frame to desired size, and fix it defining the scaling vector by the left mouse click.
While defining the scaling vector, you may use the OTM Isotropic option, if you want to keep the same scaling ratio for both X and Y coordinates. Use the OTM Anisotropic option to let the scaling ratios be independent, as results from scaling to reference vector ratio. Use the OTM Horizontal / Vertical options if you want to resize the raster only along horizontal or vertical axis, accordingly.
You may want to enter known X and Y scale factors numerically. Use Input bar with scale system (SxSy) activated automatically while defining scaling vector to enter desired values. If you want to enter known length of the reference distance with endings pointed earlier as base point and end of reference vector, switch to the distance – angle system (D<A) during defining scaling vector and enter desired distance. The OTM Isotropic option should be activated in the latter case.
Use the OTM Accept option to execute resizing. The Drawing window regenerates its content to reflect the new size of raster image. Use the OTM Cancel option instead, if you want to discard whole operation.
Before final acceptance, each time you can go back and start redefining the command parameters of any phase that you already passed. Go back to defining base point, reference vector or scaling vector, by choosing the appropriate OTM Base Point / Reference Vector / Scaling Vector option (they are accessible only when passed).

The Rotate raster command is used to rotate raster drawing around fixed base point according to an angle between rotating vector and a reference vector. You may rotate several selected drawings at once, monochrome or color ones, together by the same angle. Do not use the Rotate raster command to rotate the raster image by ±90° or 180°. Use the Change orientation buttons on Parameters tab on Raster Image Properties dialog affecting logically the way the raster data are presented. Alternatively, use the Change orientation command, rearranging the raster data physically in desired way. Then use the Rotate raster command if necessary to align raster data precisely. To minimize degradation of raster data and assure best results, the same procedure is recommended when the desired angle exceeds ±45°.
Immediately after entering this option, you may redefine the default position of the base raster point marked as small gray circle with two perpendicular axes (the lower, left frame corner). You may drag the actual base point, marked as small yellow circle connected to the cursor, to desired position and accept it as a new base point by the left mouse click. If you want to align raster according to desired direction of some line visible on raster, choose a point that lies on that line. Use the OTM Default option to maintain the default base raster point position.
Then the default position for a reference vector is displayed as a gray arrow, that starts from the base point just defined, with horizontal direction. You may change the default by dragging the end of the actual reference vector, displayed as an yellow arrow with its end connected to the cursor, to desired direction and accept it by the left mouse click. You may want to place the reference vector along the line you want to align, choosing another raster point that belongs to that line. Use the OTM Default option to maintain the default reference vector position, e.g. if you are supposed to enter the rotating angle numerically.
Then the rotating vector is displayed as a red arrow, with its end connected to the cursor, which takes shape of rotating symbol. The drawing frame is still displayed in its original position. Drag the end of the rotating vector, turning the copy of the frame by desired angle and fix it defining the rotating vector by the left mouse click.
While defining the rotating vector, you may fix it using the OTM Horizontal / Vertical option, if you want to align reference line horizontally or vertically, i.e. at slope 0° or 90 °, respectively.
You may want to enter desired value of rotating angle numerically. Use Input bar with relative angle system (@<A) activated automatically while defining rotating vector to enter desired relative angle. If you want to enter known desired slope of the reference line with endings pointed earlier as base point and end of reference vector, switch to distance – angle system (D<A) during defining rotating vector and enter desired absolute angle.
Use the OTM Accept option to execute rotating. The Drawing window regenerates its content to reflect the new shape of raster image. Use the OTM Cancel option instead, if you want to discard whole operation.
Before final acceptance, each time you can go back and start redefining the command parameters of any phase that you already passed. Go back to defining base point, reference vector or rotating vector, by choosing the appropriate OTM Base Point / Reference Vector / Rotating Vector option (they are accessible only when passed).

The Change orientation command can rotate raster drawing by ±90° or 180°, or mirror it horizontally or flip it vertically. After transformation, the new left lower corner of the raster drawing remains fixed in the same position as the old left lower corner.

The Orientation dialog that is displayed contains buttons that rotate raster left, right, upside down, or perform its horizontal mirroring or vertical flipping. Click buttons as desired to reach the orientation you want to. Watch result of subsequent clicks on raster pictogram. Accept the final orientation by OK button. On the picture below, you can see the result of turning office.tif image right and then flip it horizontally.

Notice that the operation change locations of pixels in the raster file. If you want to change only logically the way the raster data are displayed, use Change orientation buttons on Parameters tab on Raster Image Properties dialog.
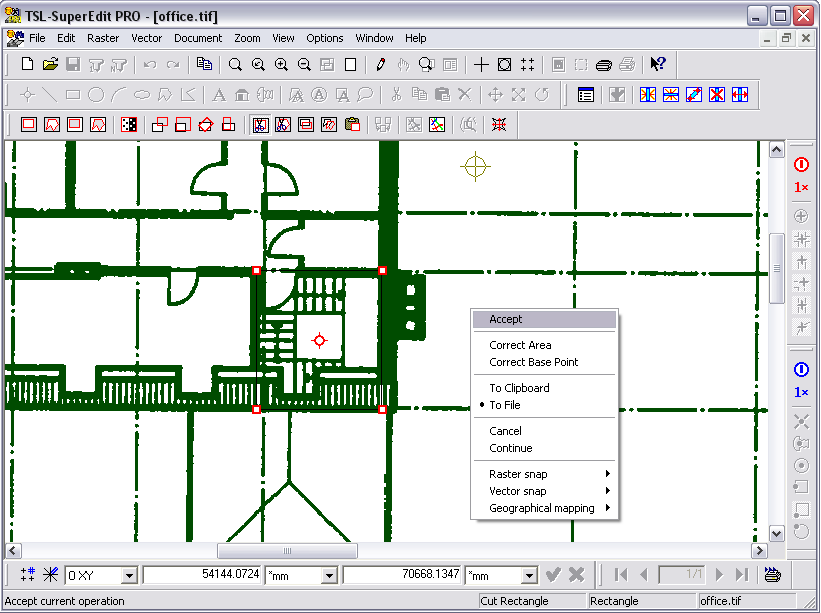
The Cut rectangle / polygon command allows you to cut raster data contained in rectangular or polygonal area from the current raster image to a separate raster file. You may use named raster file if you want to store cut image for later use. For faster editing, you may utilize the temporary raster file maintained by SuperEdit and referred to as clipboard, if you want to use it immediately in subsequent Paste raster operation and discard it at the end of the SuperEdit session.
To perform the Cut rectangle / polygon command, exactly one raster drawing – monochrome or color one – have to be selected. After cutting raster data from pointed area, monochrome drawings are cleared to white background. For color images, there is a need to specify which color should be used to fill the hole in the raster after cut operation. The intuitive white is not proper for the most of color images. The user can define the best fill color using the Options – Fill Color... function.
After issuing the Cut rectangle command, point and click the left mouse button to define opposite vertices of the rectangle that define boundary of the raster area to be cut.
After issuing the Cut polygon command, point and click the left mouse button to define subsequent vertices of the polygon. Use the OTM End polygon option to finish defining vertices (the point of the right click is not included in the polygon definition).
During defining the rectangle / polygon, you may use the OTM Reject option if you want to withdraw the rectangle / polygon being defined and start to define it again.
Immediately after defining rectangle / polygon, you may redefine the default position of the base raster point marked as small gray circle with two perpendicular axes (the lower, left corner of the extents of pointed area). The base point determines the origin of the coordinate system associated with the cut raster data and will be used in subsequent Paste raster operation as an insertion point.
Choose the OTM Accept option if you want to fix the new origin at the default position of the base point, directing left lower corner of the cut area to be an origin of the new coordinate system. Choose the OTM Zero base point option if you want to direct the new origin to coincide with the current one, keeping cut raster data in the same coordinate system as the source raster image. Alternatively you may drag the actual base point, marked as small yellow circle connected to the cursor, to other desired position and accept it as a new base point by the left mouse click. You may want to choose some detail visible on raster data to be used as a reference while inserting later the cut area in subsequent Paste raster operation. Alternatively, you may enter numerical coordinates using the Input bar if you know them in advance. Choose the OTM Accept option after defining the base point. Use the OTM Cancel option instead, if you want to discard whole operation.
Before final acceptance, each time you can go back and start redefining the command parameters of any phase that you already passed. Go back to correcting an area or a base point, by choosing the appropriate OTM Correct area / Correct base point option (they are accessible only when passed). While correcting an area, you may drag its corners (vertices) marked with red grips and choose the OTM Accept option when satisfied. Alternatively, you may define brand new rectangle / polygon from the beginning. After defining it, the old one will be automatically discarded.
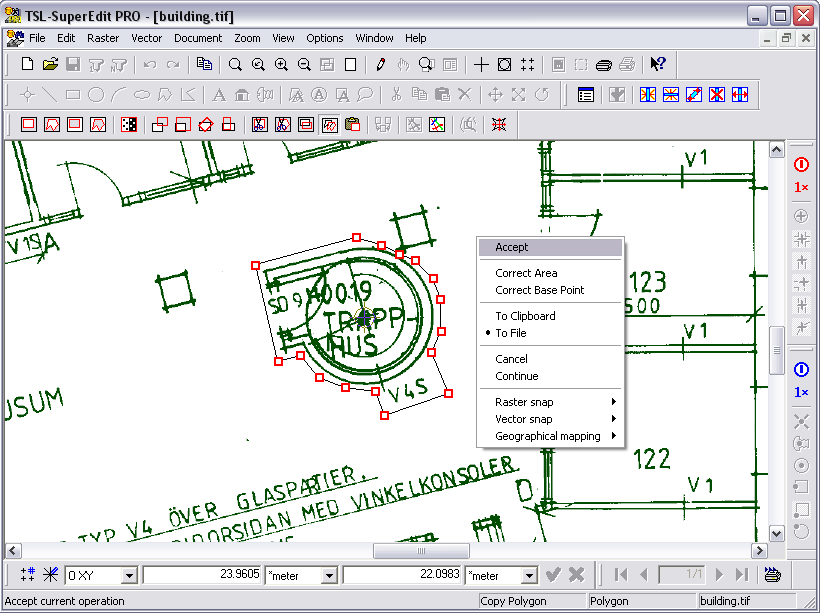
During all phases of the Cut rectangle / polygon command, you may inspect and set properly the OTM To clipboard / To file mutual options. The active one is marked with a dot symbol. These settings are remembered during current session, so you do not have to change them until necessary.
If the OTM To clipboard option is active, the command is executed immediately after final acceptance. The raster data are cut to the temporary file maintained by SuperEdit to be ready to use in subsequent Paste raster operations performed in the same or parallel instance of SuperEdit. If the OTM To file option is active, you have to complete command’s data by the file name and type chosen in the Cut to dialog. The clipboard file maintained by SuperEdit is deleted automatically at the end of the SuperEdit session, so if you want to use it in a later time, use named file instead.
The Copy rectangle / polygon command allows you to copy raster data contained in rectangular or polygonal area from the current raster image to a separate raster file. You may use named raster file if you want to store cut image for later use. For faster editing, you may utilize the temporary raster file maintained by SuperEdit and referred to as clipboard, if you want to use it immediately in subsequent Paste raster operation and discard it at the end of the SuperEdit session.
To perform the Copy rectangle / polygon command, exactly one raster drawing – monochrome or color one – have to be selected.
After issuing the Copy rectangle command, point and click the left mouse button to define opposite vertices of the rectangle that define boundary of the raster area to be copied.
After issuing the Copy polygon command, point and click the left mouse button to define subsequent vertices of the polygon. Use the OTM End polygon option to finish defining vertices (the point of the right click is not included in the polygon definition).
During defining the rectangle / polygon, you may use the OTM Reject option if you want to withdraw the rectangle / polygon being defined and start to define it again.
Immediately after defining rectangle / polygon, you may redefine the default position of the base raster point marked as small gray circle with two perpendicular axes (the lower, left corner of the extents of pointed area). The base point determines the origin of the coordinate system associated with the copied raster data and will be used in subsequent Paste raster operation as an insertion point.
Choose the OTM Accept option if you want to fix the new origin at the default position of the base point, directing left lower corner of the copied area to be an origin of the new coordinate system. Choose the OTM Zero base point option if you want to direct the new origin to coincide with the current one, keeping copied raster data in the same coordinate system as the source raster image. Alternatively you may drag the actual base point, marked as small yellow circle connected to the cursor, to other desired position and accept it as a new base point by the left mouse click. You may want to choose some detail visible on raster data to be used as a reference while inserting later the cut area in subsequent Paste raster operation. Alternatively, you may enter numerical coordinates using the Input bar if you know them in advance. Choose the OTM Accept option after defining the base point. Use the OTM Cancel option instead, if you want to discard whole operation.
Before final acceptance, each time you can go back and start redefining the command parameters of any phase that you already passed. Go back to correcting an area or a base point, by choosing the appropriate OTM Correct area / Correct base point option (they are accessible only when passed). While correcting an area, you may drag its corners (vertices) marked with red grips and choose the OTM Accept option when satisfied. Alternatively, you may define brand new rectangle / polygon from the beginning. After defining it, the old one will be automatically discarded.
During all phases of the Copy rectangle / polygon command, you may inspect and set properly the OTM To clipboard / To file mutual options. The active one is marked with a dot symbol. These settings are remembered during current session, so you do not have to change them until necessary.
If the OTM To clipboard option is active, the command is executed immediately after final acceptance. The raster data are copied to the temporary file maintained by SuperEdit to be ready to use in subsequent Paste raster operations performed in the same or parallel instance of SuperEdit. If the OTM To file option is active, you have to complete command’s data by supplying the file name and type chosen in the Copy to dialog. The clipboard file maintained by SuperEdit is deleted automatically at the end of the SuperEdit session, so if you want to use it in a later time, use named file instead.
The Paste raster command allows you to paste raster data into the current raster image. Raster data to be pasted may be taken from the clipboard file maintained by SuperEdit, from named raster drawing filled in previous Cut / Copy Rectangle / Polygon operations, or from other raster drawing originated from any source.

The Paste From. dialog that the Paste raster command invokes let you select the source of raster data. If it is a file you can inspect its content in the preview window. The chosen raster is displayed as an icon that is dragged according to the cursor’s movement.
The origin, i.e. the (0,0) point of the coordinate system associated with pasted raster data is used as insertion point in the Paste raster operation. In its subsequent phases, you may define location, size and rotation of the pasted data in similar way as while inserting vector blocks.
To perform the Paste raster command, exactly one raster drawing – monochrome or color one – have to be selected. Using the Paste raster operation, you may combine raster drawings of different scale, density, orientation and color format. The resulting raster drawing inherits the parameters of the current raster drawing. All necessary modifications and recalculations of the raster file to be pasted are made automatically.
During all phases of the Paste raster command, you may inspect and set properly the OTM From clipboard / From file mutual options. The active one is marked with a dot symbol. These settings are remembered during current session, so you do not have to change them until necessary.
If the OTM From clipboard option is active, command’s data can be defined immediately as described below. If the OTM From file option is active, you have to start from supplying the file name and type chosen in the Paste from dialog.
If you worked recently with the OTM From file option active and now you want to use clipboard data, activate the Clipboard button on the Paste from dialog that appears automatically after command starts in this mode. In opposite situation, call the OTM From file option after command starts with clipboard data, to bring the Paste from dialog instead.
The Paste raster command consists of three phases: Move raster, Resize raster and Rotate raster. They are described in former paragraphs, but their implementation during Paste raster command is shortened and limited to defining target point, scaling vector and rotating vector, respectively.
Rectangular frame corresponding to extents of the pasted raster image shows current position and shape of the pasted drawing. A copy of the frame, with position, size and rotation being changed respectively in subsequent phases, is dragged together with cursor moving when you define target point, end of scaling vector, and end of rotating vector. By pointing and clicking left mouse button, or by entering numerical values in the Input bar, you may define each phase and go immediately to the next one.
You may stop defining the command parameters at each phase when you are satisfied with current position and shape defined so far, by choosing the OTM Accept option that executes pasting raster data with all necessary recalculations as directed. Alternatively, at each phase you may skip it and switch to other latter or former one, choosing appropriate OTM Move / Resize / Rotate option as needed (the phase currently being defined is marked with the check sign). Switching to latter phases takes default settings for phases omitted; switching to former phases withdraws latter ones and enables to restart the command definition at the pointed phase.
The Move raster phase starts from the default position with origin of the pasted drawing coincident with origin of the current raster image. The origin of the pasted drawing is its (0,0) point, the point declared as a base point if the pasted raster image comes from the Cut / Copy Rectangle / Polygon operations. You may not see the pasted frame if the (0,0) point lies far away the window limits. If you want only to merge both raster drawings in the same coordinate system, choose the OTM Accept option (to merge two or more raster drawings at once, the Merge rasters command is recommended). Otherwise, fix new position of the pasted frame by defining the target point or switch to desired phase as needed using OTM options.

The Resize raster phase starts from the position defined in previous phase. If you want only to insert pasted data in desired place without transforming it further, choose the OTM Accept option. Otherwise, fix rescaled size of the pasted frame by defining the end of scaling vector or switch to desired phase as needed, using the OTM options.

The Rotate raster phase starts from the position and size chosen in previous phases. If you do not want to rotate pasted data and are satisfied with its position and size, choose the OTM Accept option. Otherwise, fix rotated position of the pasted frame by defining the end of rotating vector or switch to desired phase as needed.

Choose finally the OTM Accept option to execute pasting. If you want to correct some earlier phase of the Paste raster command, choose appropriate OTM Move / Resize / Rotate option. Use the OTM Cancel option instead, if you want to discard whole operation.

The picture below shows the result of Paste raster command. Pasted raster data has been defined by Copy polygon command performed as shown in previous paragraph.

In Paste Drawing operation, interpretation of image transparency in drawing being pasted depends on the setting of Enable image transparency option from the View tab on Configuration dialog. Those areas of pasted drawing that have been defined as transparent ones, are not pasted to current drawing if the Enable image transparency option is on. Otherwise, the whole drawing (excluding areas of color equal to fill color – see Fill Color section) is pasted, ignoring transparent mask.
The Merge rasters command allows you to merge selected raster images into a single raster file. You may merge raster images of different scale, density and orientation; each subdocument preserves its position in the world coordinates system. You may merge monochrome and color raster images or color images with different palettes. The image palette of the component image that has the greatest number of colors defines the palette of the merged raster image.
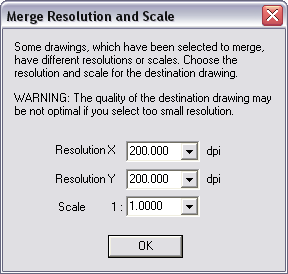
The Merge rasters command is available only when more than one raster image is selected. They can have different resolutions and scales. If either any of the resolutions differ from one another or scales are not the same, a dialog is shown to let the user choose the best of the possible parameters. A parameter can be chosen from a list (which contains values concerning all of the selected drawings) or written in an edit-box. However a typed-in value is accepted only if it is between the minimum and maximum values in the appropriate list.
On the Merge selected images to dialog, type in or choose the name of the raster file to be created as a result of merging. The types of the raster image are limited to formats, that can accommodate all possible types of source images.
Raster drawing created by Merge rasters command is saved to the external disk file and may be opened in a separate SuperEdit session.
The dimension of file being created can exceed 32768 pixels. In this case, choice of raster file formats for a destination file is limited to TIFF CALS, or BMP only.
While subdocuments are being merged into one picture, the progress of that operation (in %) is shown on the status bar of the main window.
To merge raster images together with vector drawings, use the Create raster command.
The Insert vectors command inserts (rasterizes) selected entities from the foreground vector drawing to the selected raster image within the indicated rectangular area.
To perform the Insert vectors command, exactly one raster (monochrome or color one) and one vector drawing have to be selected. Vector entities that are to be inserted came from the selected vector drawing. If you start the Insert vectors command with some vector entities already selected, only these entities are going to be rasterized. With no entities selected, all entities from the vector drawing are taken into account. These settings may be changed during command definition.
Rectangular frame corresponding to the common extents of the raster drawing and the vector entities involved, shows default inserting area. You may confirm it using the OTM Accept option form the menu that appears automatically. Alternatively, you may correct the rectangle of the inserting area by dragging its corners, if you want to exclude some parts of some entities, or define a brand new one by entering its first and then the second corner. The redefined rectangle is clipped to the common extents of the raster drawing and the vector entities involved; if the resulting area would be empty, your changes are discarded.
During all phases of the Insert vectors command, you may inspect and set properly the OTM Insert all / Insert selection mutual options. The active one is marked with a dot symbol. These settings depend on the empty or not empty selection state of vector entities when the command starts; you may change them as desired.

If the OTM Insert all option is active, all entities from the vector drawing are going to be rasterized. To rasterize only selected entities, enter the OTM Insert selection option. Then you may perform additional selection / deselection by clicking desired vector entities, selecting by window / crossing or using the OTM Select sub-menu options. Confirm final selection using the OTM Accept option. With empty selection, or with selection that lies outside the selected raster extent, the OTM Insert all option is activated.

After any changes made to the OTM Insert all / Insert selection settings, the inserting area is redisplayed back as the common extents of the raster drawing and the redefined set of vector entities involved.

Choose finally the OTM Accept option to execute inserting. Use the OTM Cancel option instead, if you want to discard whole operation.

The Create raster command creates a raster “printout” of the current drawing – vector entities, raster image or whole composite document – into a bitmap that is saved as new raster image. The Create Raster Image tabbed dialog allows you to specify parameters of the new raster, as described below. The rectangular frame displayed on top of the current document show extents to be rasterized.

After pressing OK on Create raster image dialog, the standard OTM pop-up is displayed. Choose the OTM Accept option to start raster creation. Alternatively, use the OTM Continue option if you want to correct the rectangle of the rasterized area by dragging its corners, or define a brand new one by entering its first and then the second corner. After any changes made to the rasterized area, the Create raster image dialog is displayed again to validate new extents. Use the OTM Cancel option instead, if you want to discard whole operation.
After accepting raster extents and parameters, you can select raster file name and format on Rasterize current document to dialog and specify compression options for raster file on Compression mode for output image dialog.
Now SuperEdit starts rasterization process, displaying progress dialog. After end of the rasterization process, you may examine rasterization result by opening the raster just created as a separate raster drawing.

The Window tab is used to determine which rectangular area of the current document will be rasterized, and what scale and what kind of units is to be used. You can choose one of the following options:
Display - create a raster with final extents defined by extents currently displayed in the Drawing window area;
Extents - create a raster with final extents defined by overall extents of viewports of enabled drawings in current document;
Limits - create a raster with final extents defined by total extents of current document;
Window - create a raster with final extents defined manually. You may enter desired coordinates in the First Corner and Other Corner text boxes. Alternatively, click the Pick button and define the rasterizing window on screen by entering its first and then the second corner;
Scale - specify a scale of created raster image. Because the physical size of the raster file depends on its logical extents, scale and resolution, it is up to you to choose parameters you want to change that the resulted file size would be reasonable. See Resolution tab for the file size and resolution;
Units - choose units for area coordinates that you specify for the created raster image;

The Resolution tab is used to specify raster image resolution and to verify its size. To change resolution, select the Resolution combo box and choose appropriate value. Choose the Custom option if required resolution is not shown on that list. Then enter the required value using X dpi and Y dpi edit fields.
Calculated physical image width and height may be shown in inches, millimeters or in pixels, as selected in the Image size units combo box.

Scanned drawings are often skewed, stretched, crumpled or damaged in some other way. Multi-point Calibration supports sophisticated kind of correction of deformed scanned images by applying a transformation computed according to one of five models: Helmert, affine, bilinear, biquadratic or bicubic.
Mathematically these models can be described as follows.
Isotropic linear (Helmert) model- requires at least two correction vectors.
x ’ = a 10 + a 1 x + a 2 y
y ’ = a 20 - a 2 x + a 1 y
Anisotropic linear (affine) model- requires at least three correction vectors.
x ’ = a 10 + a 11 x + a 12 y
y ’ = a 20 + a 21 x + a 22 y
Bilinear model– requires at least four correction vectors.
x ’ = a 10 + a 11 x + a 12 y + a 13 xy
y ’ = a 20 + a 21 x + a 22 y + a 23 xy
Biquadratic model– requires at least nine correction vectors.
x ’ = a 10 + a 11 x + a 12 y + a 13 xy + a 14 x 2 + a 15 y 2 + a 16 x 2 y + a 17 xy 2 + a 18 x 2 y 2
y ’ = a 20 + a 21 x + a 22 y + a 23 xy + a 24 x 2 + a 25 y 2 + a 26 x 2 y + a 27 xy 2 + a 28 x 2 y 2
Bicubic model– requires at least 16 correction vectors.
x ’ = a 10 + a 11 x + a 12 y + a 13 xy + a 14 x 2 + a 15 y 2 + a 16 x 2 y + a 17 xy 2 + a 18 x 2 y 2+a 19 x 3 + a 1,10 x 3 y + a 1,11 x 3 y 2 + a 1,12 x 3 y 3 + a 1,13 x 2 y 3 + a 1,14 xy 3 + a 1,15 y 3
y ’ = a 20 + a 21 x + a 22 y + a 23 xy + a 24 x 2 + a 25 y 2 + a 26 x 2 y + a 27 xy 2 + a 28 x 2 y 2 + a 29 x 3 + a 2,10 x 3 y + a 2,11 x 3 y 2 + a 2,12 x 3 y 3 + a 2,13 x 2 y 3 + a 2,14 xy 3 + a 2,15 y 3
The a ij parameters in each model are computed from the least mean squares formula, based on data provided by correction vectors. Each correction vector starts from the actual point (x n o, y n o) of the raster and ends in its desired position (x n *, y n *). The evaluated calibration function generates actual raster modification vectors that try to approximate the corrections imposed by user within the limits imposed by the chosen calibration model. They are shown as calculated vectors, each of which starts from the corresponding actual point (x n o, y n o) and ends in the model-computed corrected point (x n ’, y n ’).
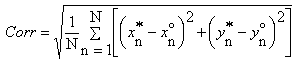
where N is the number of calibration data (correction vectors), and sqrt of mean-square error (mean-square difference between the requested and model-computed positions):
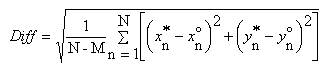
where M is the model order (the minimal number of vectors required to determine the model coefficients). With M == N, the Diff is not computed because it has no statistical meaning, as the all requested points will be matched exactly. Generally, the Diff should be small enough comparing to Corr.
After issuing the Calibrate raster command, you may start immediately defining correction vectors in default Add free vectors mode, described below. You may use the OTM Execute option to apply transformation imposed by current Calibration model to raster data. This activities may be sufficient for simplest matching raster images with known numerical data, e.g. basing on the drawing frame visible on the raster drawing, with known nominal dimensions. More sophisticated use of the Calibrate raster command possibilities may be accomplished using the Calibration toolbar that supervises more advanced actions as described below.

The Load vectors button allows you to load calibration vectors from a CAV file to which they were previously saved. Practically, the calibration vectors may be re-used only if applied to exactly the same image for which they were defined.
The Save vectors button allows you to save calibration vectors to a CAV file for further usage. The file format is ASCII. The file extension is CAV. The coordinates are listed in units defined for the raster image being calibrated (see Raster Image Properties dialog), so you cannot re-use the CAV file if you change the image units.
The Save report button allows you to save calibration report in a file with the extension REP. The calibration report includes: date, time, the name of calibrated raster file, the calibration area, the name of calibration model used, the mean square length of requested correction vectors, the mean square calibration error and the list of correction vectors. Three points describe each correction vector in the calibration report: point to be corrected, its requested position and its position after calibration.
The Add free vectors button is used to define correction vectors one by one manually. First, enter a raster point to be corrected. Choose visible detail on raster data, which nominal coordinates are known, point it, and click the left mouse button. Use Raster Snap and Magnifying Glass when appropriate. It will become the starting point of a new correction vector. Then you enter target position for this point. Enter desired coordinates numerically using Input bar. It will become the ending point of the correction vector. After entering these two points, the new correction vector is displayed as a Requested vector arrow (default red).
The Add free vectors button is automatically activated after the Calibrate raster command starts, so you may immediately start defining free correction vectors. During defining each vector, you may use the OTM Reject option if you want to withdraw the current vector being defined and start to define it again. Before final acceptance, you may drag endings of the vectors defined previously to correct them; use the OTM Delete option to delete the previously defined vector. The latter option is accessible only if you call OTM using right click while the cursor is over some vector. You may define any number of correction vectors. Choose another function using appropriate buttons in the Calibration toolbar if necessary.
The Add net-based vectors button is used to define correction vectors one by one but with reference to pre-defined set of target points. In the situation when a raster image needs to be calibrated to match e.g. map coordinates grid, the functions automates the most standard activities. The CALIBRATOR procedure performs auto zooming to next grid point, and provides precise definition of target points without typing their coordinates.
If you enter the Add net-based vectors action with no net defined, the procedure starts from the Define net action and then continues with defining net-based vectors.
The net points defined using the Define net button are used as Target points (ends) of correction vectors - the user needs only to select the corresponding Raster points of correction vectors. Moreover, SuperEdit performs automatic zooms around the points in question, and switches automatically to successive pre-defined net points, which maximizes the operator's speed. The system zooms around the first point of the base net and you are asked to provide the corresponding raster point of the correction vector.
The OTM Next option allows you to skip defining start of the correction vector ending at the current net node. You may want to skip subsequent correction vector if a quality of the raster lying beside the nominal point is not good enough, or if the nominal point is outside the raster.
The OTM Previous option moves you back to definition of previous point, if you want to correct it.
With the OTM Next / Previous Node option, you may switch to next or previous node independently if the calibrating vector has been defined there or not.
With the OTM Next Empty / Previous Empty Node option, you may switch to next or previous node where the calibrating vector has not been defined yet.
If some of these options are disabled, it means that there are no nodes of given type in chosen direction.
With the OTM Delete Current option, you may delete the calibration vector from current node if it has been defined by mistake. This option is disabled if there is no vector at current node.
After skipping some vectors by the OTM Next option, you may decide that in fact you want to define them. For that purpose, switch the OTM Skip defined option on and press the Add net-based vectors button again. SuperEdit takes you to the first nominal point you have skipped and then to any other that has undefined correction vector. Alternatively, you may want to correct once more, redefine or simply examine all correction vectors entered so far. For that purpose, switch the OTM Skip defined option off and press the Add net-based vectors button again. Now you can correct raster points where defined or define them from the beginning where skipped. Use the OTM Reject option while correcting existing vectors if you do not want to change it. The OTM Skip defined option is accessible in Calibration Options dialog as a check box.
The OTM Finish option allows you to stop defining the correction vectors using the calibration net base. The alternative way to break this process is to activate the Add free vectors button. Do not press the Esc key on the keyboard to do it; it cancels the whole Calibrate raster command, similarly as the OTM Cancel option does. However, if you did not save the changes made to correction vectors, the system asks you to confirm it and gives you a chance to break exiting action if you pressed the Esc key by mistake.
The Add entities-based vectors button is used to define correction vectors one by one but with reference to subsequent vertices of selected vector objects. This case is convenient when you can supply (or create) a nominal vector drawing associated with the raster drawing, where actual shapes and positions of objects in raster drawing are defined by vertices of vector entities.
If you start the Calibration command with some vector entities already selected, they will be used as reference entities if applicable. If you enter the Add entities-based vectors action with no entities selected, or if the selection does not contain entities with vertices, the procedure starts from the Select entities action and then continues with defining entities-based vectors.
The vertices of vector entities chosen using the Select entities button are used as Target points (ends) of correction vectors - the user needs only to select the corresponding Raster points of correction vectors. Moreover, SuperEdit performs automatic zooms around the points in question, and switches automatically to successive nominal vertices, which maximizes the operator's speed. The system zooms around the first vertex of the first entity and you are asked to provide the corresponding raster point of the correction vector.
The details and options of Add entities-based vectors action are analogous to that of Add net-based vectors action.
Five Calibration model buttons allows you to declare the model to be used in the calibration process: Helmert model, Affine model, Bilinear model, Biquadratic model, Bicubic model with properties described at the beginning of this section. If you choose too high model order to be used with current number of correction vectors, the Toggle preview and Execute buttons become disabled. The type of Calibration model is remembered during SuperEdit session, so you do not have to change them until necessary.
The Toggle vector list button allows you to show/hide the numerical details of the calibration model.

The vectors can be previewed in the Raster Calibration Results dialog. The list box lists all Raster points and Target points as well as individual errors between Calculated points and Target points. The error values let you determine which correction vector is to be examined if its error is much worse than others are. The list can be sorted by any chosen column, to easily find e.g. the greatest error. Current Number of vectors, as well as Mean square correction and Mean square error are displayed below the list; these values assist you in choosing appropriate Calibration model. If you click a vector in the list, SuperEdit zooms automatically to show the vector at the current AutoZoom level. The AutoZoom level may be changed using the Calibration Options dialog. You may delete chosen vector by highlighting it on the list and hitting the Del key on the keyboard.
Release the Toggle vector list button if you want to close the Raster Calibration Results dialog.
The Toggle preview button allows you to switch the graphical preview of the calibration effects.
Before calibration is performed, the user may preview its mathematical model to see whether it satisfies the requested corrections. The preview displays requested Correction vectors in red and Model vectors in yellow. The calibration area is covered by a cyan reference net that is transformed according to calibration model into a blue calculated net. For Helmert, Affine and Bilinear models, the net is reduced to the four-corner frame. For Biquadratic and Bicubic models, density and shape of the calculated net shows how the calibration process will modify the raster image.
The colors of preview elements may be changed using the Calibration options dialog.
If the preview is on, any changes made to calibration model or correction vectors are immediately recalculated and shown by SuperEdit. Release the Toggle preview button if you want to remove the preview elements from Drawing window.

After evaluating the transformation's coefficients and previewing it visually, you may apply the calibration using the Execute button. After successful execution, you will be asked if you want to save calibration report (you may save it later using the Save report button).
Since performing proper calibration is often a trial-and-error process, its execution is separated from accepting the whole Calibrate raster command. After execution, you may want to examine individual correction vectors, still displayed on the screen, to see how chosen calibration model fulfills required corrections. With the Toggle preview button active, you may assure that raster data are transformed exactly along calculated vectors. If the correction vectors have been defined as net-based ones, you may automate examining process using the Add net-based vectors button with the Skip defined vectors option switched off. Use the Undo / Redo buttons on the Main toolbar to compare raster data before and after calibration is made. The Undo / Redo actions during calibration process are limited only to changes made to raster data, and not to the correction vectors, and their range cannot reach changes made before the Calibrate raster command start.
It has no sense to use repeatedly the Execute button for the same calibration data; it will rather distort raster data. It is unadvised to perform new calibration e.g. with model of higher order, defined by new correction vectors defined from the beginning on raster data once calibrated using model with lower order, because each calibration slightly deteriorates raster details.
If you are not satisfied with current calibration results, push the Undo button on the Main toolbar. Now you may complete calibration data by adding or adjusting correction vectors, and/or choosing another calibration model if appropriate; finally push the Execute button to perform new calibration from the beginning.
The Define net button starts defining the calibration net that makes it easier to enter larger series of correction vectors. When you calibrate an image, you often have a grid of points that should be placed in a regular way. In most cases, there are crossing points of the coordinate system on a map; they form a rectangular mesh. The command launches the Calibration Net dialog where you may enter numbers of horizontal and vertical net vertices, single cell width and height and the net insertion point.

Use the Pick button on the Calibration Net dialog to move the net by dragging its left lower corner and define the Net insertion point in Drawing window. Use the Create button to finally define the net.
The net vertices supply Target points’ coordinates to be used by the Add net-based vectors command.
The Select entities button starts defining the selection set that makes it easier to enter larger series of correction vectors. This case is convenient when you can supply (or create) a nominal vector drawing associated with the raster drawing, where actual shapes and positions of objects in raster drawing are defined by vertices of vector entities.
After activating the Select entities button, you may perform additional selection / deselection by clicking desired vector entities, selecting by window / crossing or using the OTM Select sub-menu options. Confirm final selection using the OTM Accept option. With empty selection, or if the selection does not contain entities with vertices, the Add entities-based vectors action cannot start properly. You may select segments, rectangles, polylines and polygons or complexes that contain such entities; other entities, like circles, texts or icons, even when selected, will not be taken into account.
The subsequent vertices of vector entities that the selection set is consisted of supply Target points’ coordinates to be used by the Add entities-based vectors command.
The Calibrate raster command supports a multi-point calibration of a whole raster image or any rectangular part of its area. After the Calibrate raster command starts, the calibration area, shown by cyan rectangle, is taken from the raster image extents; the Calibrate extents button is pushed and becomes disabled. You may change the calibration area simply by dragging its corners and defining other area. Then the Calibrate extents button is automatically released and becomes enabled. You may push it to reset the calibration area back to the raster image extents. Alternatively, you may use the OTM Delete option to delete the redefined frame, when the cursor is over edge of the rectangle; the frame defining calibration area will be restored automatically to the raster image extents.
The Set options button brings up the Calibration options dialog.

With help of thisdialog you may set colors for calibration preview elements and define default Auto Zoom level for vectors preview and editing operations. The Auto Zoom scale may be set to Current, which means that the currently used zoom level will be kept constant. Otherwise, you may define it as M:N, which means M screen pixels to N raster image pixels, or as None, which turns off the Auto Zoom feature. This method of scale declaration gives you the best displaying precision with fixed accuracy while working with raster data.
Additional Skip defined vectors check box gives you opportunity to set or clear this option before the Add net-based vectors action starts.
The Accept button lets you finally finish the Calibrate raster command, accepting its results. Using the OTM Accept option does the same.
The Accept button is available only after executing calibration that effectively changed raster data. Otherwise, use the Cancel button if you want to quit the Calibrate raster command.
If you did not save the changes made to correction vectors, the system asks you to confirm it and gives you a chance to break exiting action if you changed your mind.
The Cancel button lets you finally finish the Calibrate raster command, canceling changes made to raster data if they have been done. Using the OTM Cancel option or hitting the Esc key on the keyboard do the same.
If you did not save the changes made to correction vectors, the system asks you to confirm it and gives you a chance to break exiting action if you changed your mind or pressed the Esc key by mistake.
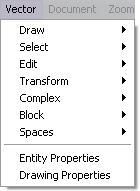
Vector commands are active only when a TVD vector drawing is selected for editing. If currently opened composite document does not contain any TVD drawings, you may add a new one using the Document – Add New Vector menu option. When a TCD contains multiple TVD drawings, only one may be selected for editing.
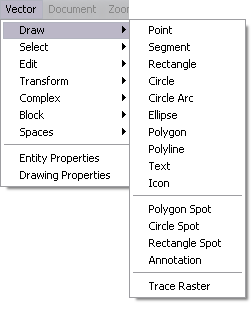
To define a point, click the Point button on the Vector toolbar, move the drawing cursor to desired position of the point and click the left mouse button. Points with no size are displayed as small circles with 8 pixels diameter, independently of the view scale. If you set the point size from the Thickness box on the Tools page of the Point properties dialog to some non-zero value, it will be used as absolute value of point diameter. You may also use Fill brush and Fill color combo boxes if you want the point to be filled.
The new point is in the selected state so you can still adjust it’s positions by dragging the grip. You can also invoke the Properties dialog that lets you change it’s position and tools used to draw it.
The Point tab is the first tab of the Properties dialog invoked for a selected segment entity. It consists of x and y coordinates of the poiny. Units used are set in the General tab of the Drawing Properties dialog. You can change all coordinates as needed.
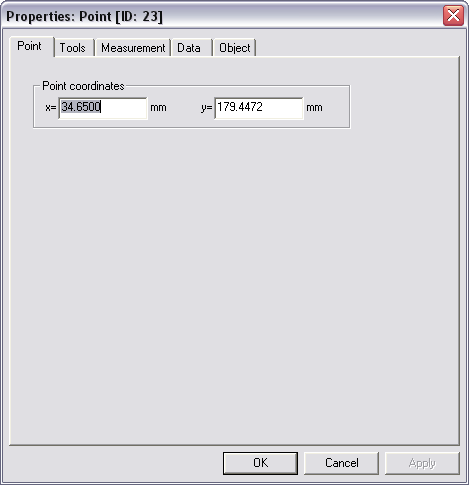
To draw a segment, click the Segment button in the Vector toolbar. The shape of the drawing cursor changes. It becomes the same as the picture on the face of the button just clicked. To enter the first endpoint move the cursor to the desired position and click the left mouse button. The second endpoint is defined by the current cursor position and it is dragged according to the mouse movements. The next left click enters the second endpoint and defines the segment.
The new segment is in the selected state so you can still adjust the positions of endpoints by dragging their grips. You can also invoke the Properties dialog that lets you change the positions of endpoints and tools used to draw the segment.
The Segment tab is the first tab of the Properties dialog invoked for a selected segment entity. It consists of x and y coordinates for both the first and last ends of the segment. Units used are set in the General tab of the Drawing Properties dialog. You can change all coordinates as needed.

To draw a circle, click the Circle button in the Vector toolbar. The shape of the drawing cursor changes. It becomes the same as the picture on the face of the button just clicked. To enter the center point move the cursor to the desired position and click the left mouse button. The point entered becomes the first endpoint of the radius. The second endpoint of the radius (and the whole circle) is defined by the current cursor position and it is dragged according to the mouse movements. The next left click enters that point and defines the circle.
The new circle is in the selected state so you can still adjust its center position and size by dragging the appropriate grips. You can also invoke the Properties dialog that lets you change the geometry of the circle and tools used to draw it.
The Circle tab is the first tab of the Properties dialog invoked for a selected circle entity. It consists of x and y coordinates of the center point and the radius of the circle. Units used are set in the General tab of the Drawing Properties dialog. You can change all values as needed.
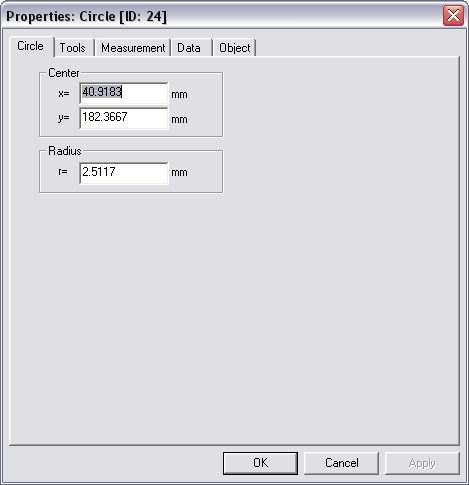
To define a circular arc, click the Circle Arc button on the Vector toolbar, move the drawing cursor to desired position of the beginning of an arc and click the left mouse button; then move the drawing cursor to desired position of the end of the arc and click the left mouse button again. Now drag the shape of the arc, defining its medium point with third click. From the Circle Arc properties dialog, you may define its center, radius and starting and ending angles.
The new circle arc is in the selected state so you can still adjust its ends and medium positions by dragging the appropriate grips. You can also invoke the Properties dialog that lets you change the geometry of the circle arc and tools used to draw it.
The Circle Arc tab is the first tab of the Properties dialog invoked for a selected circle entity. It consists of x and y coordinates of the center point, the radius of the circle arc and the start and end angles of it. Units used are set in the General tab of the Drawing Properties dialog. You can change all values as needed.
To define an ellipse, click the Ellipse button on the Vector toolbar, move the drawing cursor to desired position of the center of the ellipse and click the left mouse button. Now drag the shape of the ellipse, defining its both axis as the corner of the rectangle with ellipse inscribed. From the Ellipse properties dialog, you may define its center, lengths of both semi-axes and the angle of slope of the first axis.
The new ellipse is in the selected state so you can still adjust its center position and size by dragging the appropriate grips. You can also invoke the Properties dialog that lets you change the geometry of the ellipse and tools used to draw it.
The Ellipse tab is the first tab of the Properties dialog invoked for a selected ellipse entity. It consists of x and y coordinates of the center point, lengths of major and minor axes of the ellipse and angle among the major ax and the OX ax of coordinate system. Units used are set in the General tab of the Drawing Properties dialog. You can change all values as needed.
To draw a rectangle, click the Rectangle button in the Vector toolbar. The shape of the drawing cursor changes. It becomes the same as the picture on the face of the button just clicked. To enter the lower left corner, move the cursor to the desired position and click the left mouse button. The upper right corner of the rectangle (and the whole rectangle) is defined by the current cursor position and it is dragged according to the mouse movements. The next left click enters that point and defines the rectangle.
The new rectangle is in the selected state so you can still adjust its corners by dragging the appropriate grips. You can also invoke the Properties dialog that lets you change the corner coordinates of the rectangle and tools used to draw it.
The Rectangle tab is the first tab of the Properties dialog invoked for a selected rectangle entity. It consists of x and y coordinates for the four corners of the rectangle listed clockwise. Units used are set in the General tab of the Drawing Properties dialog. While changing any coordinate, others are changed accordingly as to maintain the rectangular shape of the entity.

The Draw Text procedure consists of two phases. In the first phase, you define a content and some parameters of a text, in the second - its position and extents. Click the Text button in the Vector toolbar to enter the first phase. The Properties dialog is displayed with the Text tab active. You can enter the content of the text (multi-line texts are allowed) and choose a text style. You can change the values as needed. Choose the OK button in the Properties dialog to go on to the second phase.
The shape of the drawing cursor changes. It becomes the same as the picture on the face of the toolbar button just clicked. If the Height parameter in the Settings tab has a positive value, the border of the text is displayed under the cursor (the size of it is calculated according to the Height parameter value). You can drag the whole text by the point defined by its insertion point. Click the left mouse button to define a position of the text. If the Height parameter in the Settings tab has a negative value (it means it is not defined), you have to point by the cursor the position where the defined text is to be placed. Click the left mouse button to define a final position of the text. The other point of the text is defined by the current cursor position and it is dragged according to the mouse movements but still its placement depends on text alignment flags (see the Settings tab in the Text Properties dialog). The next left click enters that point and the text extents are defined.
The new text is in the selected state so you can still adjust its size and position by dragging the appropriate grips. You can also invoke the Properties dialog that lets you change all the text parameters including tools used to draw it.
The Text tab is the first tab of the Properties dialog invoked for a selected text entity. It contains a multi-line edit box for content of the text and coordinates of its insertion point. The other boxes are not used in the current release.
The Style tab is the second tab of the Properties dialog invoked for a selected text entity. It contains a combo box with text styles. The list of accessible styles is established in the Style tab of the Drawing Properties dialog. Edit boxes with x and y coordinates for the insertion point of the text, text Height (units used for all those values are set in the General tab of the Drawing Properties dialog), Angle and Ratio are displayed below. There are combo boxes used to choose text Border and horizontal and vertical Alignments. The style chosen from the style list defines initial values of parameters in the Style tab. You can change all settings as needed.
The insertion point of a text is a point with coordinates defined by the text alignment flags: x coordinate by horizontal and y coordinate by the vertical flag. This point is used for defining the position of the text and for dragging it (it is exactly the position of the first text grip). While changing text extents by dragging the second grip, a position of the insertion point remains constant.
Text height is the height of the text font. The font is selected in the Font dialog that can be invoke from the Style tab of the Drawing Properties dialog.
Text ratio is the ratio that multiplied by the width of a chosen font gives the effective font width used to draw the text. It is applies to True Type fonts only.
To draw a polyline, click the Polyline button in the Vector toolbar. The shape of the drawing cursor changes. It becomes the same as the picture on the face of the button just clicked. To enter the first point, move the cursor to the desired position and click the left mouse button. Every next polyline point is defined by the current cursor position. The point and an appropriate edge are dragged according to the mouse movements. The next left click enters that point (and the edge). To end the points sequence, click the right mouse button. To end polyline with the last entered point choose the End polyline option in the pop-up menu. Choose the Step back option to adjust position of the last entered point and then proceed with the next point.
The new polyline is in the selected state so you can still adjust its corners by dragging the appropriate grips. You can also invoke the Properties dialog that lets you change the polyline corners’ positions and tools used to draw it.
The Polyline tab is the first tab of the Properties dialog invoked for a selected polyline entity. It consists of a list box with x and y coordinates of all polyline points. Selected point coordinates are displayed in editing boxes. Units used are set in the General tab of the Drawing Properties dialog. The selected point can be removed (the Remove button) or its coordinate(s) can be changed (the Accept button). A new value(s) entered will be treated as the coordinate(s) of a new point (the Add button).

To draw a polygon, click the Polygon button in the Vector toolbar. The shape of the drawing cursor changes. It becomes the same as the picture on the face of the button just clicked. To enter the first point, move the cursor to the desired position and click the left mouse button. Every next polygon point is defined by the current cursor position. The point and an appropriate edge are dragged according to the mouse movements. The next left click enters that point (and the edge). To end the points sequence, click the right mouse button. To end polygon with the last entered point choose the End polygon option in the pop-up menu. The edge connecting the first and the last entered point is added automatically. Choose the Step back option to adjust position of the last entered point and then proceed with the next point.
The new polygon is in the selected state so you can still adjust its corners by dragging the appropriate grips. You can also invoke the Properties dialog that lets you change the polygon corners’ positions and tools used to draw it.
The Polygon tab is the first tab of the Properties dialog invoked for a selected polygon entity. It consists of a list box with x and y coordinates of all polygon points. Selected point coordinates are displayed in editing boxes. Units used are set in the General tab of the Drawing Properties dialog. The selected point can be removed (the Remove button) or its coordinate(s) can be changed (the Accept button). A new value(s) entered will be treated as the coordinate(s) of a new point (the Add button).

The Draw Icon procedure consists of two phases. In the first phase, you define a file name with an icon, in the second - the icon’s position and its extents. Click the Icon button in the Vector toolbar to enter the first phase. The Properties dialog is displayed with the Icon tab active. You can enter the file name and then examine its parameters (some of them you can also change). Choose the OK button in the Properties dialog to go on to the second phase.
The shape of the drawing cursor changes. It becomes the same as the picture on the face of the toolbar button just clicked. The rectangular border of the icon is displayed under the cursor. You can drag the border with the point defined by the insertion point of the icon. Click the left mouse button to define a final position for the icon.
The new icon is in the selected state so you can still adjust its extents and position by dragging the appropriate grips. You can also invoke the Properties dialog that lets you change all the icon parameters including tools used to draw it.
The Icon tab is the first tab of the Properties dialog invoked for a selected icon entity. It consists of the pathname of an icon file and x and y coordinates of the icon’s center (units used are set in the General tab of the Drawing Properties dialog). You can use the Browse button to invoke the standard Windows Open dialog. The Parameters button enters the Raster Image Properties dialog with parameters used for reading and displaying the data of the icon’s raster file.
Insert entities may come from two sources: they can be references to blocks defined by user or they can be imported from DXF drawings (in the last case they are converted appropriately to internal vector data base structures). Insert entities display list of entities maintained by block definition they refer to, with individual transformation defined by insertion point, x and y scales, and rotation angle. Insert entities may be selected by clicking into any of entities displayed through them. Selection by window and by crossing works as well as for simple entities. You may drag the insert entities pointing its insertion point mark and dragging the whole insert entity to new position. You may apply the Move / Scale / Rotate transformation to insert entities and use them as components for complex entities in the same way as for other entities.
The Insert tab is the first tab of the Properties dialog invoked for a selected insert entity. It contains a combo box with current block referred by the insert entity and list of all block names contained in the drawing, from you may choose another connection. The x and y coordinates of the insertion point, the x and y scales and the rotation angle are displayed in separate edit boxes and may be changed as needed.
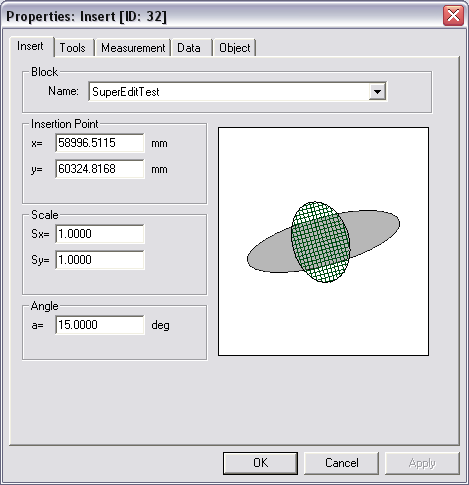
There are some predefined complex entities, like polygon / circle spots and annotations defined below. The user may also define his own complex entities using the DWM Complex – Create function.

The first tab named Components on the Complex Properties dialog lets you choose the appropriate entity from the list or from the preview window. Select the entity clicking its name on the list or clicking the entity itself, displayed in preview window. You may switch displaying mode in the preview window, from full view to single component view, by right clicking into its area. Click Properties... button or double-click entity’s name on the list or the selected entity in preview window, to examine properties for individual sub-entity. In case of nested complexes, several levels of Properties dialogs may follow.
By the Tools and Style tabs on the Complex Properties dialog you can examine, define and edit properties that become the common for all components of a complex. Initially, only the tools and style parameters with the same values for all entities are shown. All values that you define or change are applied to all sub-entities.
On the Measurement tab, you may examine the algebraic sum of length and areas of components of the complex, according to signs declared for each individual component.
Polygon spot is complex entity consisting of polygon and a text that can be used as a description connected with the polygon. The text size is automatically pre-set to fit whole text inside the polygon nearby its center. The text alignment flags and the border type are predefined but can be changed. In the Components tab of the Polygon Spot Properties dialog, you have an access to the properties of the polygon and the text entities separately.
The Draw Polygon Spot procedure consists of two phases. In the first phase, you define a polygon, in the second - you define a text, which can be used as a description connected with the polygon. Click the Polygon Spot button in the Vector toolbar. The shape of the drawing cursor changes. It becomes the same as the cursor used within Draw Polygon operation. Define a polygon in the way that is described in the Draw Polygon paragraph. Then the Properties dialog is displayed with the Text tab active. Define a text content in the way that is described in the Draw Text paragraph. The text is automatically placed inside the polygon nearby its center.
The new polygon spot is in the selected state so you can still adjust positions of the polygon vertices, add new ones, delete some of them or/and adjust the text position and extents by dragging the appropriate grips. You can also invoke the Properties dialog for both the polygon and text that lets you change all the parameters including tools used to draw the elements.
Circle spot is complex entity consisting of circle and a text that can be used as a description connected with the circle. The text size is automatically pre-set to fit whole text inside the circle nearby its center. The text alignment flags and the border type are predefined but can be changed. In the Components tab of the Circle Spot Properties dialog, you have an access to the properties of the circle and the text entities separately.
The Draw Circle Spot procedure consists of two phases. In the first phase, you define a circle, in the second - you define a text, which can be used as a description connected with the circle. Click the Circle Spot button in the Vector toolbar. The shape of the drawing cursor changes. It becomes the same as the cursor used within the Draw Circle operation. Define a circle in the way that is described in the Draw Circle paragraph. Then the Properties dialog is displayed with the Text tab active. Define a text content in the way that is described in Draw Text paragraph. The text is automatically placed inside the circle nearby its center.
The new circle spot is in the selected state so you can still adjust the circle position and size and the text position and extents by dragging the appropriate grips. You can also invoke the Properties dialog for both the circle and text that lets you change all the parameters including tools used to draw the elements.
An annotation is a complex entity consisting of a text and an arrow. There is no specific properties dialog for annotations but you have access to the properties of the text and the arrow entities separately. The text tab in the text properties dialog is the same as in ordinary text entity. The arrow entity is used with an annotation context only so the Arrow tab is described here as the separate subparagraph.
The Add Annotation procedure consists of two phases. In the first phase, you define a text, in the second - you define the pointing end of an arrow (the first end is placed automatically in the center of the text border). Click the Add Annotation button in the Vector toolbar. Then the Properties dialog is displayed with the Text tab active. Define a text in the way that is described in Draw text paragraph. Then the shape of the drawing cursor changes. It becomes the same as the cursor used within Draw Segment operation. The pointing end of the arrow is defined by the current cursor position and it is dragged according to the mouse movements. The next left click enters the endpoint and defines the arrow.
The new annotation is in the selected state so you can still adjust the text position and extents and/or the arrow’s pointing end position by dragging the appropriate grips. You can also invoke the Properties dialog for both polygon and arrow that lets you change all the parameters including tools used to draw the elements.
The Arrow tab is the first tab of the Properties dialog invoked for a selected Annotation entity and with the arrow entity chosen. It consists of x and y coordinates for both first and last end of the arrow and the length the arrow’s spike called Size. Units used are set in the General tab of the Drawing Properties dialog. You can change coordinates of the last arrow end (the first end is placed automatically in the center of the text border) and the size as needed.
Trace raster command is a specialized tool for semiautomatic tracing of raster lines. The command allows converting raster lines to vector polylines built of segments that are automatically fitted to raster lines curvature.

After the command is started you have to click a point on raster line you want to trace. The SuperEdit tracer analyses raster background and returns a polyline section that matches the pointed raster line. The line stops at breaks and intersections, so if you want to continue tracing you must click the continuation of the raster line. SuperEdit finds the next section and connects its start point to the end point of the previous one. At the end you get a single polyline covering the whole road you passed.
You may define several separate traces, thus vectorizing all necessary shapes in the raster drawing. Finished traces are drawn in color defined as current one in vector drawing (default: black). The starting part of the trace just being defined is drawn in red, while the current section just vectorized is blue, with red square grips placed in its vertices. Each time you may drag vertices of the last polyline section to correct them. Use the OTM Add Vertex / Delete Vertex options pointing where appropriate to add or delete vertices. Use the OTM Delete option to discard the whole section. The latter options are accessible only if you call OTM using right click while the cursor is over some polyline’s vertex or its edge, appropriately. To delete the section, you may use the OTM Last Section – Discard option as well.
After tracing, each section has a direction, a property that is designed to help you while following raster image lines. SuperEdit assumes that the start point of the section is an end-point closer to the last user click. You may change the section direction assumed by SuperEdit using the OTM Last Section - Flip option.
Several options modify the behavior of this basic function. They may be accessed through OTM optionsactivated by right click.
Accept – confirms the whole action and finishes it;
Repeat – confirms the currently traced polyline finishing it and continues action with the next trace;
Restart – discards the currently traced polyline removing it and continues action with the next trace;
Sections – traced sections of polylines will not be connected into one polyline;
Linked trace – traced sections of polylines will be connected into one polyline;
Closed trace – traced sections of polylines will be connected into one polyline that will be closed when you finish the trace;
Line profile – the option defines what kind of lines will be traced, and sets tracer parameters accordingly (see Tracer tab on Configuration dialog) to match raster line best. The preset values are listed on sub-menu as straight lines, twisted lines, soft curves, sharp curves;
Last section – you may perform some additional actions with the last traced section:
Discard - discard whole section and start again from the last good point
Flip - reverse the last segment direction
Detach - finish the currently traced polyline with the previous section and start a new polyline from the current section;
Manual section – you may interrupt automatic tracing and enter a manually defined polyline where the tracer cannot vectorize some complicated parts of raster. The option starts typical polyline definition function. Further processing of manual sections is the same as for automatic ones;
View widths – when activated, the polyline being traced and its last section are shown with their width defined by settings in Tracer tab on Configuration dialog; when switched off, the actual width will be applied only to finished traces;
View tracing – when activated, you may observe the process of vectorizing in dynamical fashion point by point – it gives you an orientation in tracing precision and possible errors; when switched off, the whole sections appear instantaneously;
Optimize merging – if the option is set, the sequence of sections that form a single polyline trace is connected in such a way that the end point of the previous section is connected to the start point of the next one. Duplicated points are merged into single ones whenever possible;
Auto Zoom – when the trace goes through the raster line that finishes out of the screen, SuperEdit performs an automatic zoom around the latest point allowing you to make a decision where to go with a next segment. The Auto Zoom scale may be set to Current, which means that the currently used zoom level will be kept constant. Otherwise, you may define it as M:N, which means M screen pixels to N raster image pixels, or as None, which turns off the Auto Zoom feature.
Use the OTM Cancel option, if you want to discard whole operation and delete all traces defined. If OTM Repeat option is set and you use the OTM Cancel option or Escape key, additional message asks you if you really want to discard the whole operation.
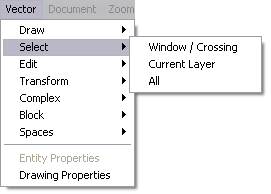
Window / Crossing – it starts the selection process defined by a dragged rectangle. Define the first corner of a rectangular area of selection with left mouse click, and drag the mouse cursor while holding the left mouse button pressed. If you drag the rectangle starting from left to right, it is drawn with blue solid line and means selection by window, i.e. all objects that lie entirely inside the rectangle are taken into account. If you drag the rectangle starting from right to left, it is drawn with blue dashed line and means selection by crossing, i.e. all objects that lie inside the rectangle or are crossed by it are taken into account. You can observe the cursor shape that changes to the small rectangle with arrow pointing the current direction. Release the left mouse button when the opposite corner is defined as needed. Relevant objects will create a new selection; this is emphasized by the small “=” sign near the selecting arrow. If you want to add pointed objects to the current selection, press Ctrl+Shift keys before releasing the left mouse button. You can observe the small “+” sign near the selecting arrow. If you want to remove pointed objects from current selection, press Ctrl+Alt keys before releasing the left mouse button. You can observe the small “-” sign near the selecting arrow. Effective selection mode and operation is described in the status line. If you want to quit the Select Window / Crossing action, press the Esc key on the keyboard or drag the cursor back to its starting position until it changes its shape back to the special cross. You may use the shortcut for entering the Select Window / Crossing action by pressing the Ctrl key on the keyboard and then pressing the left mouse button and dragging the cursor while holding the left button down. You can observe changes of the cursor shape and hints in status line displayed appropriately. This shortcut is accessible only in the normal state of SuperEdit Drawing window. You can still use short left clicks for normal pointing actions.

Cut – use this option to cut all entities from the selection to the Clipboard. Selected entities are copied together with layers, styles and patterns they refer.
Copy - use this option to copy all entities from the selection to the Clipboard together with layers, styles and patterns these entities refer to.
Copy To…- use this option to copy all entities from the selection to the file chosen in the Copy To... dialog, together with layers, styles and patterns these entities refer to, in a form of complete TVD drawing.
Copy All To... - use this option to save all entities together with layers, styles and patterns these entities refer to, in an external TVD vector drawing; the Copy To... dialog lets you choose a pathname for a target drawing.
Paste - use this option to paste all entities together with layers, styles and patterns these entities refer to, from the Clipboard to the foreground vector drawing (the option is enabled if Cut or Copy actions have been previously performed).
Paste From... - use this option to paste all entities together with layers, styles and patterns these entities refer to, from a TVD vector drawing; the Paste From... dialog lets you choose a pathname of a source drawing.
Import - use this option to import all vector entities supported by SuperEdit together with layers and text styles from DXF drawing format file, to the foreground vector drawing; the Open dialog lets you choose a pathname of a source drawing.
SuperEdit can include (by Import command) an external DXF file that is compatible with AutoCAD DXF drawing database version number R10 - R14 (both included). In the case of re-import of a file that was previously exported by SuperEdit all it's structure and tools are recreated so it looks and behaves like the original TVD vector drawing. In other cases some tools such as: vector hatches other then SOLID, LINE, ANSI31, ANSI37, NET and values of variable thickness' of polylines are lost. You can import DXF file with all coordinates and distances treated as they are expressed in predefined kind of units. The units can be choosen from Default units for DXF file combo-box in the Options - Configuration - Edit dialog.
Export - use this option to export all selected vector entities together with layers and text styles to DXF drawing format file. The Save As dialog that is displayed lets you choose a name and destination directory of the file. The Form of the Export DXF File dialog that is displayed after lets you choose binary or ASCII form of the exported file.
The format of exported DXF drawing file is compatible with AutoCAD DXF drawing database version number R13 and R14. The structure of the DXF drawing is conformed with SuperEdit TVD vector drawing structure as far as layers, blocks and tools are concerned. You can notice some minor divergences that result from different attitude to base notions; for instance: AutoCAD line entity can not be thick but SuperEdit segment can, SuperEdit complexes are realized as AutoCAD blocks, bitmap TVD hatches are not supported, but vector hatches are, borders of texts are not supported either.
You can export DXF file with all coordinates and distances recalculated to predefined kind of units. The units can be choosen from Default units for DXF file combo-box in the Options - Configuration - Edit dialog.
Export All - use this option to export all vector entities from the foreground vector drawing together with layers and text styles to DXF drawing format file. The Save As dialog that is displayed lets you choose a name and destination directory of the file. The Form of the Export DXF File dialog that is displayed after lets you choose binary or ASCII form of the exported file. See previous paragraph for details of exported DXF drawing format.
Gives a user possibility of importing points from text file to the current vector drawing. All but comment line of a file describes a single point. The description consists of x and y coordinates, together with (optionally) a name of point entity and a name of layer the point is to be placed. You can define the way a content of a text file is to be interpreted using dialog that may be activated from Open page of Configuration dialog.
During export the following objects generate points: Point, Segment, Rectangle, Polyline, Polygon. Only points of selected objects are exported.
Move – use this option to move a selection to a new location. This location is defined by position of the base point of the selection. Immediately after entering this option, the new location of the selection is defined by the cursor's position. The selection is still displayed in its original position with the base point marked as small yellow circle with two perpendicular axes. A copy of the selection is dragged by its base point marked as small red circle according to movements of the cursor that takes shape of the moving symbol. Drag the copy of the selection by moving its base point to a desired position, and click the left mouse button.
To change the base point position use the OTM Base Point option and define a new base point position by the left mouse click or with Input bar and keyboard.
Use the OTM Cancel option to discard the action.

Scale - use this option to scale a selection according to a ratio of a reference vector and a scaling vector. The base point of the selection is marked as a small yellow circle with two perpendicular axes. It defines the first point of both vectors. The reference vector default position is displayed as thick yellow arrow. The scaling vector is displayed as thick red arrow, with its end connected to the cursor, which takes shape of scaling symbol. Drag the copy of the selection moving the end of scaling vector to desired size, and click the left mouse button.
To change the reference vector position use the OTM Reference vector option and define a new position of reference vector by the left mouse click or with Input bar and keyboard.
To change the base point position use the OTM Base Point option and define a new base point position by the left mouse click or with Input bar and keyboard.
Use the OTM Cancel option to discard the action.

Rotate - use this option to rotate a selection by an angle between the horizontal reference vector and a rotating vector. The base point of the selection marked as small yellow circle with two perpendicular axes, defines the first point of both vectors. The reference vector is displayed as thick yellow arrow. The rotating vector is displayed as thick red arrow, with its end connected to the cursor, which takes shape of rotating symbol. Drag the copy of the selection moving the end of rotating vector to desired angle, and click the left mouse button.
To change the reference vector position use the OTM Reference vector option and define a new position of reference vector by the left mouse click or with Input bar and keyboard.
To change the base point position use the OTM Base Point option and define a new base point position by the left mouse click or with Input bar and keyboard.
Use the OTM Cancel option to discard the action.


Create – use this option to create a new complex entity from the currently selected entities. New complex entity keeps together all child entities taken from the main drawing list. New complex entity has its own internal vector data base identifier; the individual name and external links may be assigned to it.
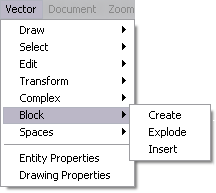
To define (create) a block definition, draw appropriate entities, select them and choose the DWM Block - Create option. Write the name for new block in the Name box on the Blocks page and click the Add new button. Alternatively, choose an existent block from the list and click the Change button, if you want to redefine it. Click the OK button to close the dialog. Now show the position of the insertion point of the block, marked with small yellow circle. It will be used during inserting block references. Choose the OTM Accept option to create the block. The selection used to define the block list will be left untouched, removed from the drawing or replaced by insert reference according to setting of the OTM Leave / Remove / Replace selection option.

To redefine existing block e.g. by correcting some of its entities, insert its reference in 0,0 insertion point, with 1,1 scale and at 0 angle, exploding it at once. Make necessary editing changes, set final selection and choose the OTM Block - Create option choosing the same block name to change. After entering again 0,0 insertion point, choose the OTM Accept option with the OTM Remove selection option activated.
To insert the block reference into the drawing choose the DWM Block - Insert Create option or press the Insert button on the Vector toolbar. From the Insert properties dialog, choose the block definition to be used, set appropriate values for insertion point, scale and rotation angle while examining the appearance of the insert in the Preview window. You may check boxes for presetting desired transformation parameters, and / or check additional boxes for automatic Repeat, Explode or Complex options. Now you may define interactively moving, scaling and rotating operations that define insert transformation. Operations marked as preset ones will be skipped. Using appropriate OTM options, you may switch between various actions, set additional Auto Repeat option and Explode / Complex options, examine and change Properties again, and finally choose the OTM Accept option to accept the inserted reference. If you want to repeat the action, use the OTM Repeat option. With the OTM Auto Repeat option active, you may insert multiple references to the block in single operation; use the OTM Accept option when finished. With the OTM Explode option active, the inserted reference will be instantly exploded, duplicating all entities from block definition list into the drawing. The OTM Complex option works similarly, but exploded entities are grouped in complex.
If OTM Repeat option is set and you use the OTM Cancel option or Escape key, additional message asks you if you really want to discard the whole operation.
A type of dialog that is launched by the Properties option depends on a selection state:
in the empty selection state a tabbed dialog Drawing Properties is launched where you can examine, define and edit units, tools, layers, text styles and patterns for the whole drawing;
in the case of a single, simple entity selection it enters the Entity Properties tabbed dialog where you can examine, define and edit parameters concerned with that entity. In the case of a single complex entity or multiple entity selection, the first tab named Components on the Entity Properties dialog lets you choose the appropriate entity from the list or from the preview window displayed within the tab. By the Tools and Style tabs on the Complex / Selection Properties dialog you can examine, define and edit parameters that become the common ones for all components of a single complex or for all selected entities in a multiple selection. Initially, only the tools and style parameters with the same values for all entities are shown. You can leave some values empty, meaning different for different entities, or define values for those that should be equal for all entities in the current selection.
Both dialogs are described in two subsequent paragraphs.
To invoke the Vector Drawing Properties dialog choose the Properties option in popup menu displayed after right mouse click, or use Properties option in Vector menu - both in situation where there are no entities selected. The dialog consists of tabs that are described in next paragraphs.
The General tab is the first tab of the Properties dialog invoked for a drawing. It consists of effective drawing extents defined by x, y coordinates of the lower left and upper right point of drawing extents. The drawing extents are calculated from extents of entities defined in the drawing. The only way of change them is to add new entity or delete/edit an existing one. Units used in the Drawing Properties and Properties dialogs of all entities can be chosen from the combo box Units.

You may use the Tools tab of a drawing's Properties for setting tools separately for lines, fills and bitmap hatches that are used to draw entities. The drawing's tools are used as default tools for new entities. You may re-define each entity tools independently, as they have precedence over those of a drawing.
For Line, you can choose Thickness, Style and Color (style is taken into consideration only when thickness equals zero). For Fill, you can choose Brush and Color. Transparent mode affects both lines and fills. If it is on, you can see through the entity drawn with these tools all entities lying beneath as well as the background documents - otherwise they are covered by this entity.
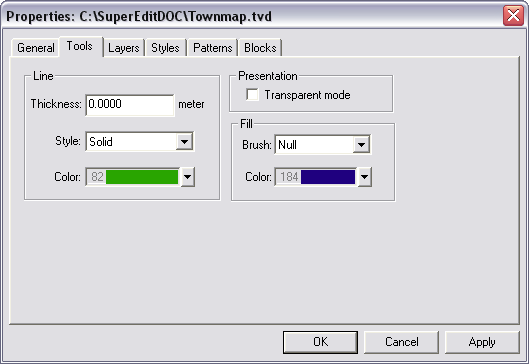
The Layers tab lists all drawing layers. There is a predefined layer with name 0. To examine or edit layer’s features, highlight a layer in the list. For the highlighted layer its Visibility, Activity and being Current modes as well as the number of entities, are displayed. You can change the visibility and activity mode as needed. There is always exactly one current layer, so switching this mode on for highlighted layer automatically turns it off for the layer that has been previously current.
To remove the highlighted layer use the Remove button. If the button is disabled, it means that the highlighted layer is not removable (layer 0 is an example of such a layer) or is not empty.
To change the name of a highlighted layer, type in a new name in the Name edit box. Click the Change button to change the name of the highlighted layer in the Layers list box.
To add a new layer, type in a new name in the Name edit box. Click the Add New button to add the new layer to the Layers list box. Set Visibility, Activity and Current modes of the added layer according to your requirements.
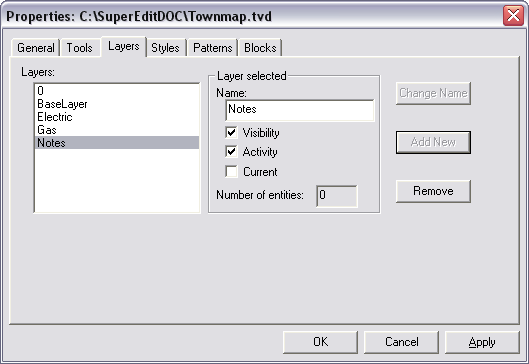
The Styles tab lists all text styles defined in the drawing. There are some predefined styles with commonly used fonts: ARIAL, TIMES and COURIER. To examine or edit style’s features, highlight a style in the list. For the highlighted style its Height, Angle, Ratio values as well as Border and Alignment types are displayed.
The Height value is the height of the text font. A negative height value means the height is not defined. If a text entity has to be drawn with such a style, it has to be defined with own, positive height value. It can be done explicitly in the Settings tab of the Text Properties dialog, or implicitly, by dragging the second grip of the text frame.
The Angle value is the default value to be used while defining texts with given style.
The Ratio value is the ratio that multiplied by a width of chosen font gives the effective font width used to draw a text. It applies to True Type fonts only.
The font is set using standard Font dialog that is invoked by the Font button.
There are combo boxes for choosing a Border type and horizontal or vertical Alignment type.
You can change all settings as needed.
To remove the highlighted style, use the Remove button. If the button is disabled, it means that the highlighted style is not removable (the predefined styles and styles that some text entities refer to them are examples of non-removable styles).
To change the name of a highlighted style, type in a new name in the Name edit box. Click the Change button to change the name of the highlighted style in the Text Styles list box.
To add a new style, type in a new name in the Name edit box. Click the Add New button to add the new style to the Text Styles list box. Set values for Height, Ratio and Angle, set Font details, and choose Border and Alignment type of the added style according to your requirements.
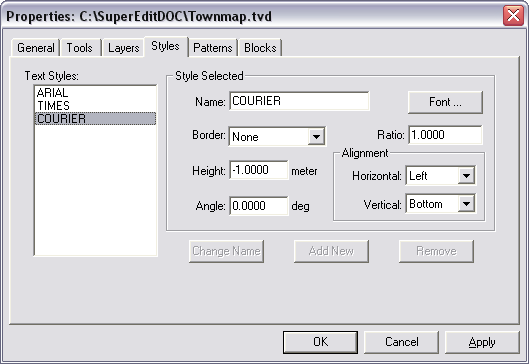
The Patterns tab lists all patterns defined in the drawing. There are some predefined patterns with self-explaining names: HORIZONTAL, VERTICAL, FORWARD DIAGONAL, BACKWARD DIAGONAL, CROSS and DIAGONAL CROSS. To examine or edit a pattern’s features, highlight a pattern in the list. For the highlighted pattern its Distance, Thickness, Angle, line Style (it is taken into consideration only when thickness equals zero), Color and Crossing feature are displayed.
You can change all settings as needed.
To remove the highlighted pattern, use the Remove button. If the button is disabled, it means that the highlighted pattern is not removable (the predefined patterns and patterns that some entities refer to them are examples of non-removable patterns).
To change a name of the highlighted pattern, type in a new name in the Name edit box. Click the Change button to change the name of the pattern in the Hatch Patterns list box.
To add a new pattern type in a new name in the Name edit box. Click the Add New button to add the new pattern to the Hatch Patterns list box. Set Distance, Thickness and Angle values, choose a Color and a line Style and set Crossing feature of the added pattern according to your requirements.

The Blocks tab lists all block definitions. To examine or edit a block, highlight it’s name on the list. You can see it in the preview window.
To remove the highlighted block use the Remove button. If the button is disabled, it means that there are inserts of it in a vector drawing. To enable the button you should remove all those inserts first.
To change the name of a highlighted block, type in a new name in the Name edit box. Click the Change button to change the name of the highlighted layer in the Blocks list box.
To find out how to add a new block see Vector editing commands – Block – Create paragraph.
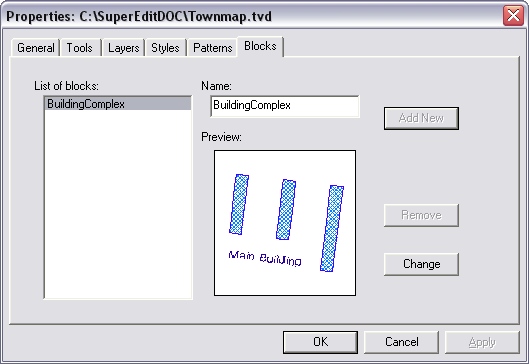
To invoke an Entity Properties dialog choose the Properties option in popup menu displayed after right mouse click, or use Properties option in Vector menu - both in situation where there are some entities selected. In the case of a single complex entity and multiple entity selection, the first tab named Components on the Entity Properties dialog lets you choose the appropriate entity from the list or from the preview window, displayed within the tab.

The Properties dialog of the entity consists of tabs that are specific to the chosen entity (they are described in paragraphs related to given entity) and the tabs that are common to all entities. They are described in next paragraphs.
The layout of the Tools tab for an entity is an extension of that for the drawing. It is the same as far as Line, Fill and Transparency are concerned. These drawing tools define default values for the corresponding entity tools. A Pattern box lets you define hatch pattern parameters used by an entity. You can choose a pattern from the list of accessible patterns. The list is established in the Patterns tab of the Drawing Properties dialog. For the selected pattern the values of its Distance, Thickness, Angle, Style, Color and Crossing are displayed.
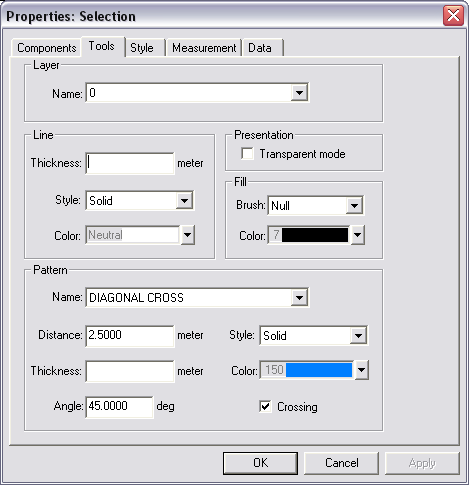
You can change all settings as needed, so that any single entity can have its own tools.
Selecting a new pattern in the list or the same once more resets values of all parameters according to original values defined for the pattern.
Controls of tools that are not available for the selected entity are disabled.
For most entities (segment, circle, rectangle, polyline, polygon) only the Length can be measured. For some entities (circle, rectangle, and polygon), the Area can be measured, too. These values are listed in the Measurement tab. When the values are out of context for some entities, the appropriate boxes are empty.

For complex entities, as well as for multiple entity selection, measurements of length and areas may be defined as an algebraic sum of appropriate values taken from their component entities. To accomplish this effect, you may declare the sign for length and area individually for each entity to be taken into account during computation of complex measurements, using the Sign button. The default value is the “+” (plus) sign, displayed in the button before the value of interest; you may change it to “-“ (minus) sign pressing it once. Optionally, you may declare to skip the measurement of the entity in complex calculation pressing the sign button again – the “0” (zero) sign is displayed.
Each entity in the vector database may have a list of various user-defined, numerical (integer or double) or string data attributes assigned to it. Each attribute has a unique string key. Numerical attributes may have assigned an action like addition, subtraction or skipping. The key is used as an index and can be supplied by the external database or defined by your own. The action defines the rule of the attribute value computation up to the top of the entities’ hierarchy. Data tab on tabbed Entity Properties dialog lets examine, define and edit attributes, their keys, types and actions.
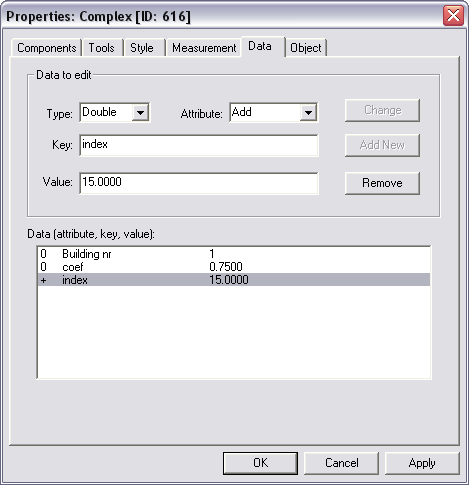
The list of numerical data attributes of complex entity consists of the top-level user-defined attributes and those defined by its sub-entities. The identically keyed numerical attributes of sub-entities are computed up to the top of the entity hierarchy. The computation is done according to the following rules:
Attributes on the sub-entity level that have the same key and type give a single computed attribute of that key and type;
A value of computed attribute is automatically calculated as a sum or subtraction of sub-entities attribute values according to actions assigned to them.
Notice that Properties dialog for a multiple selection supports Data tab for that selection with the full attribute capabilities. In this way, you may easily examine the on-line computed aggregated data values for attributes of interest if they are defined for individual components.
Each entity has its original numerical identifier, called object identifier. An entity can also have its own object name. Both are defined on Object tab. The object identifier is automatically defined and assigned when an entity is added to the drawing. Object name can by defined and edited by you. You can use it for various purposes - see stamps libraries for example.
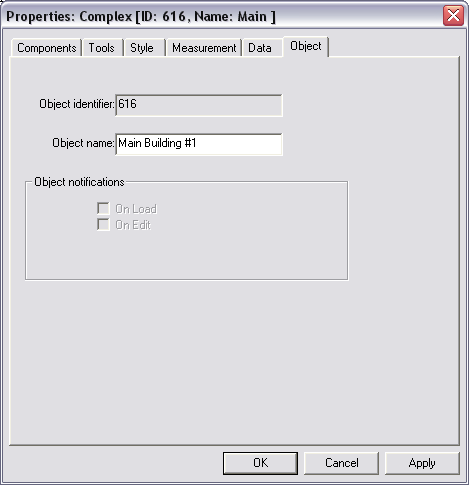
The next group of checkboxes displays the state of active object notifications that are not supported in the current release.
To inspect and/or redefine various general geometrical parameters of newly created walls click Wall and Spaces Options button on Drawing/Spaces submenu or on Walls and Spaces toolbar. The Wall and Spaces Options dialog is displayed. It consists of two tabs: General and FI 2002 that are described in next paragraphs.
The layout of the General tab consists of three control groups: Distances, Angles and Units. The Units list-box lets you select the units that values of other parameters are expressed in. Distances group consists of Wall width, Maximal wall width and Resolution controls. The first define nominal wall width. Validation procedure considers parallel and semi-parallel lines drawn with this distance one from other as edges of a single wall. It looks for them searching lines that are drawn no further one from another then Maximal wall width. Ends of lines are considered different if distance between them is no more then Resolution parameter value. Angles group consists of Minimal angle and Maximal angle controls. The first control defines a maximal divergence between lines that the validation procedure considers parallel. The validation procedure considers lines that are drawn in such a way that an angle between them is bigger then Minimal angle value and smaller than Maximal angle value as askew and lists the situation as “lines not parallel” problem.
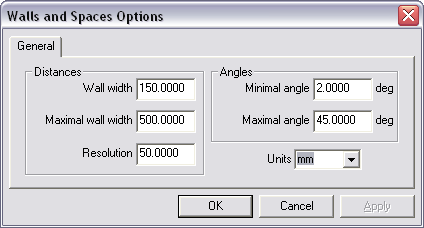
FI 2002 tab defines parameters for FI 2002 estate description standard. It assumes that walls and spaces objects are defined on three separate layers called NTA, BTA and BRA. Spaces, as usually, are defined by walls’ edges. For each layer you can define a distance between the wall’s axis and edge for left and right sides separately. The distances are called Left side penetration depth and Right side penetration depth accordingly. Depths can be defined as numbers (in No more then column) or as 0.5 Wall width parameter value taken from General tab (in To axis column) or as in a wall with zero width (in 0 column). Additionally for each layer you can check its visibility (to be or not to be displayed) and activity (to enable or disable edition) flags.
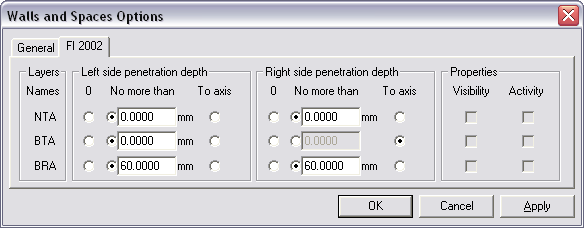
To perform a validation process click Validate Spaces option button on Drawing/Spaces submenu or on Edit Spaces toolbar. Because the validation process validates selected spaces only, the button is active if at least one vector object is selected. If no problems are found, the message box with “No error detected” message is displayed. If validation procedure discovers any problems, then the Validate Spaces dialog is displayed. To make it easier for you to realize what the problem is, HyperDoc zooms around the area of drawing that the current problem concerns. On the Problems control a current problem description is displayed. You can scroll through the list of problems back and forth using mini toolbar that is placed below Problems control. It’s |< and >| buttons let you inspect the first and the last of problems, using << and >> buttons you can scroll through problems not solved yet only (see below) and < and > buttons realize ordinary, one by one scrolling mode.
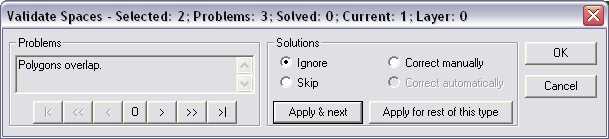
HyperDoc recognizes 9 classes of problems:
Geometry is ambiguous – validating procedures can not recognize edges of walls;
Not parallel lines – segments are found with the angle between them bigger then Minimal angle and smaller then Maximal angle so they can not define a wall;
Overlapping polygons – polygons that model spaces overlap each other;
Holes are not inside outer contour – to model spaces that are entirely embedded in other spaces (e.g. pillars) a notion of a hole is introduced. In properly structured drawing each hole should be inside an outer contour – otherwise the problem is reported;
Angle between successive segments is too small – the problem is reported if angle between successive edges of space (polygon) is smaller then the minimal angle;
Polygons contain each other – the problem is reported if a modeling space polygon contains entirely another polygon of this kind;
The segment is too short or it's length is 0 – the problem is reported if a segment that define a wall is shorter then a width of that wall;
Holes contain each other – the problem is reported if a pillar modeling hole contains another hole of this kind;
Cannot define wall through hole – for the sake of making validation algorithms reasonably simple it is not allowed to define a wall that goes through some hole(s).
Clicking a radio-button in Solutions box on the dialog you can choose one of four possible solution of the problem. To ignore a problem click the Ignore radio-button (the problem remains not solved and will be reported in the next validation; you can inspect these problems by special buttons of the mini toolbar). To remove objects that are the reason of a problem from the selection click the Skip radio-button. To solve the problem and repair the drawing by editing it manually click the Correct manually radio-button. To repair the drawing by editing it automatically click the Correct automatically radio-button (the button can be disabled for some kinds of problems).
To apply a single solution and proceed to the next problem click Apply & next button. If you want apply the current solution to the rest of problems of the same kind use Apply for the rest of this type button.
Standard OK and Cancel buttons approve and withdraw all changes made accordingly and close the dialog. You can always click Validate spaces button once again to check if all problems are already solved or to continue editing the drawing and solving the rest of problems.
To define a new, vertical wall click Add Vertical Wall button. Then define a center point of the wall (see a hint in the status bar). To do it, move the cursor to the desired position and click the left mouse button. If a place is chosen reasonably (e.g. inside a polygon - but not rectangle) the vertical wall has been drawn, otherwise there is no effect but you still have a chance to choose a place for a center point again (notice that the hint is still displayed). The new wall is in the selected state so you can adjust its position by dragging the center grips. You can also drag ending grips and make the wall oblique. Click right mouse button to display option menu where you can select Accept to confirm a wall.
The newly drawn wall divides the space it goes through into two spaces. One of them is marked by a blue asterisk. Zoom closer if you cannot see it. This one becomes a new space after the defining process has been finished. The second one preserves identifier of the original space. If you want the second space become the new space and the first preserve identifier of the original space, click the left mouse button in the area of the second space. The asterisk changes its placement and the option menu is displayed. Further role changes are still possible. Simply choose Continue option on Option menu and click the left mouse button in desired space again.
To finish Add Vertical Wall command, choose Accept option on Option menu.
To define a new, horizontal wall click Add Horizontal Wall button. Then define a center point of the wall (see a hint in the status bar). To do it, move the cursor to the desired position and click the left mouse button. If a place is chosen reasonably (e.g. inside a polygon - but not rectangle) the horizontal wall has been drawn, otherwise there is no effect but you have still a chance to choose a place of centre point again (notice the hint is still displayed). The new wall is in the selected state so you can adjust its position by dragging the centre grips. You can also drag ending grips and make the wall oblique. Click right mouse button to display Option menu (see below).
The newly drawn wall divides the space it goes through into two spaces. One of them is marked by a blue asterisk. Zoom closer if you cannot see it. This one becomes a new space after the defining process has been finished. The second one preserves identifier of the original space. If you want the second space becomes the new space and the first preserves identifier of the original space click the left mouse button in the area of the second space. The asterisk changes its placement and the option menu is displayed. Further role changes are still possible. Simply choose Continue option on Option menu and click the left mouse button in desired space again.
To finish Add Horizontal Wall command, choose Accept option on Option menu.
To define a new, oblique wall click Add Oblique Wall button. Then define two end points of the wall in the way you define an ordinary segment (simply follow hints in the status bar). If a segment is drawn in a reasonable place (e.g. inside a polygon [but not rectangle]) an oblique wall is displayed, otherwise there is no effect but you have still a chance to draw a segment again (notice the hint is still displayed). The new wall is in the selected state so you can adjust its position by dragging the centre grips. You can also drag ending grips. Click right mouse button to display Option menu (see below).
The newly drawn wall divides the space it goes through into two spaces. One of them is marked by a blue asterisk. Zoom closer if you cannot see it. This one becomes a new space after the defining process has been finished. The second one preserves identifier of the original space. If you want the second space becomes the new space and the first preserves identifier of the original space click the left mouse button in the area of the second space. The asterisk changes its placement and the option menu is displayed. Further role changes are still possible. Simply choose Continue option on Option menu and click the left mouse button in desired space again.
To finish Add Oblique Wall command, choose Accept option on Option menu.
To delete a wall, click Delete Wall button. Than point the wall you want to delete by drawing a segment that crosses it. If the segment is drawn reasonably, the pointed wall is redrawn with grips in gray color. Additionally a little red cross is drawn on one of spaces the wall is adjacent to. The space is to be deleted as the result of Delete Wall command. The other one will incorporate the area of deleted wall and space. If you want the other one to be deleted and the first one to incorporate the area of deleted wall and space click the left mouse button in the area of the other space. The cross changes its placement and the option menu is displayed. Further role changes are still possible. Simply choose Continue option on Option menu and click the left mouse button in desired space again.
To finish Delete Wall command, choose Accept option on Option menu.
To move a wall, click Move Wall button. Than point the wall you want to move by drawing a segment that crosses it. If the segment is drawn reasonably, the pointed wall is redrawn as selected. You can edit it by moving its grips. The original wall position is still displayed.
To finish Move Wall command, choose Accept option on Option menu.
If a wall is in the selected state you can activate pop-up option menu by clicking the right mouse button. The menu consists of following options:
Accept – choose the option to finish corrections of wall’s position and accept its shape as it is; the newly defined wall changes the space it goes through: it create a new one (formerly marked by an asterisk) and shrinks the original one;
Define Wall – option displayed in defining wall commands; choose the option to start a wall’s definition process from the beginning;
Horizontal Wall – option displayed in defining wall commands; a check mark drawn before the option’s text confirms a type of the wall, that is being defined; use to option to change the current wall type to horizontal one;
Vertical Wall – option displayed in defining wall commands; a check mark drawn before the option’s text confirms a type of wall, that is being defined; use to option to change the current wall type to vertical one;
Select Wall – option displayed in Delete wall and Move Wall commands; use the option to select a wall to be deleted/moved once again;
Cancel – use the option to break a command and discard the wall that is being defined or edited;
Continue – use the option to go on with the command that is being realized;
Raster Snap – the entry for the raster snap submenu (see Options and tools pop-up menu (OTM) paragraph);
Vector Snap – the entry for the vector snap submenu (see Options and tools pop-up menu (OTM) paragraph);
Geographical Mapping – the entry for the geographical mapping submenu (see Options and tools pop-up menu (OTM) paragraph);

SuperEdit is performance-optimized for viewing large raster and vector documents. For each open document, it keeps a full view of this document. This feature allows executing the Zoom-Extents command very fast. In some situations, however, the use of full view cache can somewhat decrease the quality of document display. In this case, you can issue the Regenerate command that forces full-resolution redraw without using the stored view. By setting the UseFullViewCache parameter in the supered.ini file to 0 (see the section called “SUPERED.INI file” for description of the supered.ini file), you can disable storing and using the full view cache.
Use this option if you want SuperEdit to create a new composite document (TCD) for the single image file being open. SuperEdit displays the TCD Contents window with structure of just created TCD document.
Use this option if you don’t want SuperEdit to create a new composite document (TCD) for the single image file being open. It is the way to return to the situation before you used the Switch to TCD Mode option. SuperEdit switches off displaying the TCD Contents window.
The Add Subdocument command adds a new subdocument to the current composite document. It launches a dialog box for selection of a drawing file to be added. The command is the menu version of Add... button on Composite Document dialog.
The Remove Subdocument command removes links to currently highlighted subdocuments from the composite document. It does not delete the drawings’ files, of course. The command is the menu version of Delete button on Composite Document dialog.
The New Vector command creates and adds an empty TVD drawing as the new subdocument to the current composite document. Notice the difference between this command and Add Subdocument command that can add only an existing drawing.
It is possible to a add a new vector drawing based on a prototype file (another vector drawing). The prototype file name is specified in Options - Configuration - Open dialog. You can use a browse button to find the wanted file (the chosen file name and location appears in an edit box). It is possible to choose with a check-box whether or not to use the prototype drawing. The prototype is used only if the check-box is set and the prototype-path is not empty.
Views manager, closely integrated with the TCD document, provides the means for fast previewing and defining named zoom views that are stored in the document (or in TCV files for single-file documents) for future reference. For each view, the user may add additional remarks in the description field. Because the process of regeneration takes some time, storing prepared image bitmap in the TCD document may accelerate the viewing.
When SuperEdit works in Single Image Mode, i.e. file operations are performed on a single image without TCD file, definitions of views are stored in a “ImageName.TCV” file. This additional file is automatically created by the Save command and used by SuperEdit if found in the image’s directory.
Full view, representing the entire document, is created and stored by SuperEdit automatically. Additionally the user may define named views.Both types of views may be selected as default to be shown on open.
The Views command opens a dialog that displays the list of named views and offers the choice of views-related operations. Views may be selected by clicking their names. Double clicking on the name of the view on the list is equivalent to pressing the Show button for this view. The default view is shown at the bottom of the dialog. Views-related operations are executed in response to pressing respective buttons. The Views dialog remains on the screen until the Close button is pressed.

The following command buttons are offered in the Views dialog:
New - define a new named view with View Parameters dialog. You can give a name to the currently displayed part of document. World coordinates of the current zoom window will be stored as the view definition.
Modify - modify the parameters or name of the selected view with View Parameters dialog. You may give a new name (it must be unique) for an existing view. You may also change this view definition by typing world coordinates into appropriate boxes.
Delete - delete the selected view(s). After deleting, the list of views is updated accordingly.
Show - show the selected view. After pressing this button, the view is shown in the SuperEdit drawing window. Pressing this button is equivalent to double clicking on the view’s name on the list.
Mark - define the selected view as default one.
Only one default view is assigned to each TCD document. This view may be selected for showing when the document is initially opened.

The Select command on the Document menu and on Main toolbar toggles (switches back and forth) SuperEdit and it Drawing window between the normal and selecting state.
In the normal state, pressing the left mouse button and dragging in the Drawing window is used as a shortcut to start the Zoom Window command.
In the selecting state, the interpretation of the window entered by pressing and dragging the mouse is different. This interpretation depends on two factors: the state of the Shift key during the window input and the direction of mouse dragging (from left to right or from right to left). If the mouse was dragged from left to right, only those drawings, which lie completely inside the entered window are selected (or deselected). If the mouse was dragged from right to left, drawings with extents intersecting the entered window are selected (or deselected). If the Shift key was released during mouse action, relevant drawings are selected and remaining drawings are deselected. If the Shift key was pressed, the selection state of relevant drawings is changed (selected are deselected and deselected are selected).
It is also possible to select and deselect component drawings just clicking with a mouse on the document area. The state of Control and Shift keys is important. If the Control key was pressed, all drawings clicked on are selected, but if the Control key was released, only one of drawings clicked on is selected. While choosing drawing(s) to be selected, first the viewports are taken into account, but if there is no viewport at the mouse click point, full drawing extents areas are taken. Exactly as while selecting with window (described in the above paragraph), pressing the Shift key indicates, that the selection state of relevant drawings is to be changed (selected are deselected and deselected are selected). If the Shift key was released during the mouse click, relevant drawings are selected and remaining drawings are deselected.
For each component drawing, its visible area, called viewport, is defined. Initially (after adding the drawing to the composite document) it is set to full drawing extents. A viewport can be resized by selecting relevant drawing and dragging small black rectangles (called trackers) that appear in the corners and in the middles of edges of the selected drawing’s viewport. A viewport can be moved by selecting the relevant drawing and dragging its viewport window. The Reset Viewport command in the Document menu and the OTM Reset Viewport option resets the viewports of currently selected documents to their initial sizes (full extents of each respective drawing).

The Properties command launches the Composite Document dialog. This dialog groups together commands for composite document management on the subdocument level.
All command buttons located on the right side of the Subdocuments list apply to one ore more subdocument files that are highlighted. Using these commands, it is possible to:
change properties of individual images (like their position or color);
enable/disable displaying of images;
select and unselect images for editing;
change the order in which they overlap each other;
add/delete images to/from the composite document;
change linking path to image files;
save changes made to subdocuments;
save subdocuments under new names;
copy subdocuments to new files;
use absolute or relative path of subdocument file.
The Common Extents of the current composite documentare displayed below the Subdocuments list, together with two additional controls that let you do the following:
change the Units of the composite document (composite document extents are expressed in these units),
close the Composite Document dialog and apply the changes to the graphical screen.
The Composite Document dialog box displays a list of subdocuments that are linked to the current composite document. You can highlight the entries on this list in order to choose subdocuments for further actions.
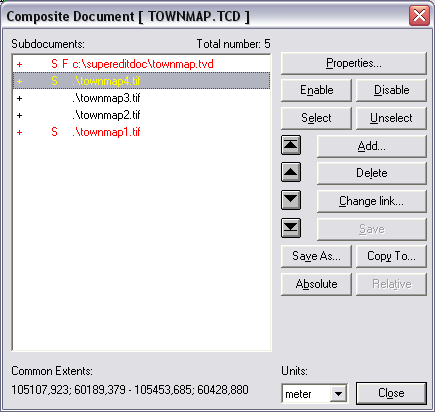
The Composite Document dialog box lists path names to subdocuments’ files, that are preceded by four status columns. The first column contains plus sign (+), if the corresponding subdocument is enabled (visible) or minus sign (-), if the subdocument is disabled (invisible). The second column may be empty or it may contain either the N/A text, if the subdocument’s file can not be found, or the R/O text, if the subdocument is open in the read-only mode. The third column contains the S character, if the corresponding subdocument is in the selected state. The names of selected subdocuments are displayed in red color in the list box. The fourth column contains the F character for a foreground TVD subdocument that is currently edited. Additionally, a foreground subdocument’s file name is displayed in gray color on the list. There can be only one foreground subdocument in each Composite Document.
For each subdocument, its visible area, called viewport, is defined. Initially, right after adding an image to the composite document, the image’s viewport is set to its full extents. Viewport extents can be changed using the Select / Edit Viewports command. The Reset Viewport command sets the viewports of currently selected images to their initial size (full extents of each respective image).
SuperEdit’s raster editing commands (Move, Clear, etc.) operate only on subdocuments that are selected. Subdocuments may be selected using either the Select and Unselect buttons in the Composite Document dialog, or clicking their names on TCD Contents window.
Most of Composite Document dialog buttons are available as options on the Composite Document Menu (CDM) that is displayed in TCD Contents window.
The following paragraphs describe commands (buttons) available in the Composite Document dialog.
The Properties... command is active only when exactly one subdocument is highlighted on the Subdocuments list. This command launches the Raster Image Properties dialog or Vector Drawing Properties dialog, depending on the current subdocument type. Using the dialog, you may inspect and set various properties and parameters of the highlighted subdocument.
The Vector Drawing Properties dialog has been described earlier.
The Raster Image Properties dialog can have two, three or four tabbed pages. The pages titled Parameters and Info is always present. The Pages tab is present only when the current raster image has multiple pages. The Colors tab is present only when at least one image page is monochrome, so that it may have a presentation color assigned.

The Parameters tab presents the following parameters that, except for the Extents, have been read from the image file header, its attributes file (TAF), or defined by the user using this dialog:
Effective Image Extents - calculated according to other parameters set for this raster image;
Scale - the nominal scale;
Resolution X x Y - the nominal horizontal and vertical resolutions of the bitmap in dots per inch;
Insertion Point - the insertion point coordinates, i.e. world coordinates of the bottom left corner of the image;
Units - units for the Insertion Point and Extents presentation;
Change orientation - buttons to rotate the view of the image left, right, by 180 degrees or perform vertical or horizontal mirroring of the view;
Image Description - optional description text.
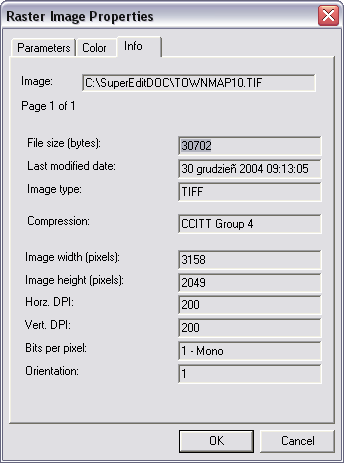
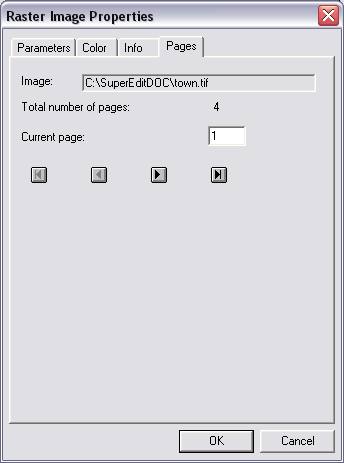
On the Colors tab, you can select a presentation color for monochrome raster image.
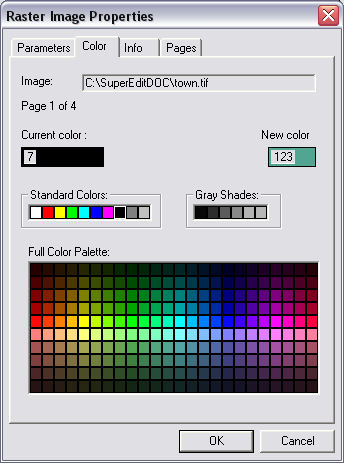
The values of image parameters are saved in the image file, if the image format allows for it. An additional attribute file, with the same name as the image file name but with TAF extension, stores all parameters in ASCII format (see the section called “Appendices” for description of the TAF file format). The additional file is located in the same disk directory as the image file. The additional attribute file is necessary, because not every parameter can be saved in the original image file. Parameters saved in the original image file override those saved in its additional attribute file. The creation and reading of attribute files can be controlled using the BRAOpenOptions parameter in the supered.ini file (see the section called “SUPERED.INI file” for description of the supered.ini file).
The parameter values are read from the image file and possibly from its attribute file. All of them can be changed, except for the Effective Image Extents that are calculated from other parameters. When any parameter has been changed, the image is considered changed, and SuperEdit asks the user for saving changes in a file, when it is about to be closed.
The Enable command turns visible all subdocuments that are highlighted on the Subdocuments list. The visibility may be also affected by the drawing’s position on the Subdocuments list (see the Subdocuments order section below).
The Disable command turns invisible all subdocuments that are highlighted on the Subdocuments list.
The Select command changes to selected the state of all highlighted subdocuments on the Subdocuments list. The S character appears before the name of each selected subdocument, which is additionally displayed, in a different color. This method of selecting is alternative to the cursor pointing method described in the Select / Edit Viewports command section below.
The Unselect command clears the selected state of all highlighted subdocuments on the Subdocuments list. The S character before the name of each selected subdocument disappears and the color of its line is changed to the standard one. This method of making unselected is alternative to the cursor pointing method described in the Select / Edit Viewports command section below.
Thefollowing four commands (buttons) allow to control the order in which the subdocuments overlap one another, when the composite document is displayed or printed. Each of them moves the highlighted subdocument entries on the composite document’s Subdocuments list.
The Bring to front command moves the highlighted subdocuments to the front end of the Subdocuments list i.e. makes them cover the other drawings.
The Bring forward command moves the highlighted subdocuments one step in the front direction on the Subdocuments list; i.e. makes them cover the drawing that immediately preceded them. Issuing the Bring forward command sufficient number of times is equivalent to issuing the Bring to front command one time.
The Send backward command moves the highlighted subdocuments one step in the back direction on the Subdocuments list, i.e. puts them under the drawing which immediately followed them. Issuing the Send backward command sufficient number of times is equivalent to issuing the Send to back command one time.
The Add... command adds a new subdocument to the current composite document. It launches a dialog box for selection of a drawing file to be added.
The Delete command removes links to currently highlighted subdocuments from the composite document. Of course, it does not delete the drawings’ files.
The Change Link... command is used to define a new path to the subdocument that is highlighted on the Subdocuments list. It is especially useful when the previous files location is not valid (indicated by N/A on the Subdocuments list), e.g. after moving it to another directory. The Change Link... command can be issued only when exactly one subdocument is highlighted on the Subdocuments list.
The Save command is active only when exactly one subdocument is highlighted on the Subdocuments list and if there are any unsaved changes made to its contents or parameters. This command saves the changes to the highlighted drawing file and/or to its associated attribute file. It operates only on the highlighted subdocument and does not save changes made to other subdocuments or to the whole composite document that should be saved using the Save command (or the Save button on the Main toolbar).
The Save As... command is active only when exactly one subdocument is highlighted on the Subdocuments list. It copies the highlighted drawing file (with its associated attributes file (TAF), if one exists) to the location specified by the user in the Save As... dialog box. The highlighted source subdocument file is left unchanged while all editing changes made to it are saved in the newly created copy. The Save As... command updates the current link from the composite document to the highlighted drawing, so that it contains the path to the newly created copy.
The Copy To... command is active only when exactly one subdocument is highlighted on the Subdocuments list. It copies the highlighted drawing file (with its associated attributes file (TAF), if one exists) to the location specified by the user in the Copy To... dialog box. The highlighted source subdocument is left unchanged while all editing changes made to it are saved in the newly created copy. The Copy To... command leaves the current composite document unchanged, i.e. linked to the original drawing file.
Use the Absolute command to display and store absolute path to subdocument file for all selected subdocuments on the Subdocuments list. The option is enabled only if all subdocument files are placed in the same directory as the composite document file, or in its subdirectories. In other case the paths displayed and stored are always absolute.
Use the Relative command to display and store relative path to subdocument file (with regard to composite document file) for all selected subdocuments on the Subdocuments list. The option is enabled only if all subdocument files are placed in the same directory as the composite document file, or in its subdirectories. In other case the paths displayed and stored are always absolute.
You may want to use relative paths for subdocuments when you want to move the composite document file with its subdocument files to another directory, drive or computer, or to use it in net environment.
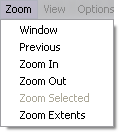
Various zooming actions allow controlling the area and presentation scale of the TCD document that is displayed in the Drawing window. They are accessible from the Zoom group of buttons in the Main toolbar.
Click the Zoom window button to define the area to be zoomed and fitted into the current shape of the Drawing window. Define the first corner of a rectangular area to be zoomed with left mouse click, and drag the mouse cursor while holding the left mouse button pressed. Dragged rectangle is drawn in red. Release the left mouse button when the opposite corner is defined as needed.
The Drawing windowdisplays the marked area of the TCD document in the new viewing scale.
In the normal state of Drawing window, you do not have to use the Zoom window button. Simply press the left mouse button and start dragging immediately or wait a while to switch to zooming action. You can observe the cursor shape that changes to the zooming cross and the Zoom window button automatically becomes pressed while defining the zooming window. You can still use short left clicks for normal pointing actions.
The Drawing windowkeeps all views created by various zooming actions on a special list. You can step back through the view list clicking the Previous zoom button.
If you want to inspect the central part of the Drawing window, click the Zoom in button to increase the presentation scale about twice.
If you want to see a greater area of the Drawing drawings, click the Zoom out button that decreases the presentation scale about twice.
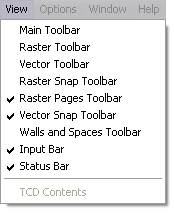
Use the option to switch on/off displaying the SuperEdit’s Main toolbar. The existence of check mark before the option’s name on View menu shows that current state is “on”.
Use the option to switch on/off displaying the SuperEdit’s Raster toolbar. The existence of check mark before the option’s name on View menu shows that current state is “on”.
Use the option to switch on/off displaying the SuperEdit’s Vector toolbar. The existence of check mark before the option’s name on View menu shows that current state is “on”.
Use the option to switch on/off displaying the SuperEdit’s Raster Snap toolbar. The existence of check mark before the option’s name on View menu shows that current state is “on”.
Use the option to switch on/off displaying the SuperEdit’s Vector Snap toolbar. The existence of check mark before the option’s name on View menu shows that current state is “on”.
Use the option to switch on/off displaying the SuperEdit’s Input bar. The existence of check mark before the option’s name on View menu shows that current state is “on”.
Use the option to switch on/off displaying the SuperEdit’s Status bar. The existence of check mark before the option’s name on View menu shows that current state is “on”.
Use the option to switch on/off displaying the SuperEdit’s TCD Contents window while working with TCD file. The existence of check mark before the option’s name on View menu shows that current state is “on”. If a single drawing file (not TCD) is opened, the option has no effect on the layout. In this case, use Switch to TCD Mode option on Document menu to display TCD Contents window.

The Configuration command provides you with a tabbed dialog box for easy modification important configurable options of SuperEdit. The Configuration command causes the changes to have an immediate effect for all commands in the current SuperEdit session. The same options are set in the supered.ini file and may be changed manually there, but that way requires restarting of SuperEdit.
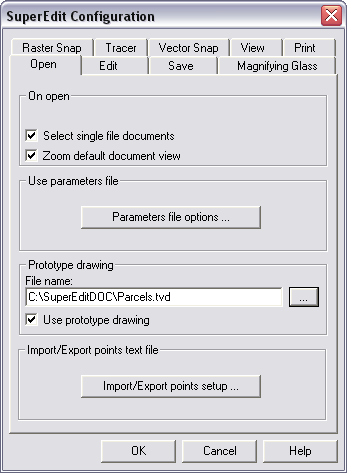
The Open tab allows you to configure options that control opening SuperEdit files:
Select single file documents
If this option is checked, SuperEdit automatically selects a single image file, or a TCD file with only one subdocument, immediately after the open operation. This option prepares the image to be ready for editing, not only viewing. This option corresponds to the AutoSelectSingleFile parameter in the [TSLRVC Library Settings] section in the supered.ini file.
Parameters file options...
The Parameters file options... button invokes External Parameters File dialog. Use it to control what kind of an attribute file (i.e. parameter file that accompanies raster file) is used.
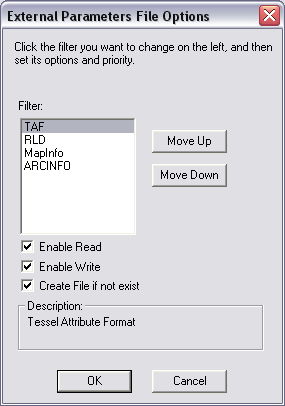
Click a name of kind of attribute file and check the way you want to use it (read while opening, write while saving, create if not exist). Use Move Up and Move Down buttons to establish priority rules. They determine what kind of attribute file is to be read if there is more then one on a disk.
Prototype drawing
A prototype drawing is the ordinary TVD vector drawing that can be used as a pattern while creating a new vector drawing (in Document - Add New Vector command).
You can use a browse button to find the wanted file (the chosen file name and location appears in an edit box).
It is possible to choose with a check-box whether or not to use the prototype drawing in Add new vector command. The prototype is used only if the check-box is set and the prototype-path is not empty.
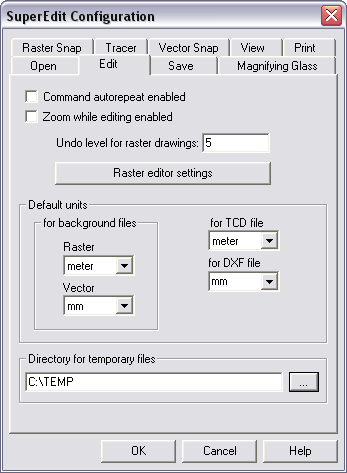
The Edit tab allows you to define the following options:
Command autorepeat enabled
You may easily call most recently used command of any type, using the Repeat option from DWM menu.
Defining simple vector entities, e.g. points, segments, ..., may be performed in automatically repeatable fashion; this feature may be switched off if not needed. With command autorepeat enabled, use OTM Break option (instead of OTM Cancel) to stop defining entities.
Zoom while editing enabled
You may use click-and-drag technique to start defining zoom window not only in idle SuperEdit state, but during most editing actions as well. This feature may be switched off if not needed.
Undo level for raster drawing
Option defines how many undo steps are allowed for raster editing operations.
Raster editor settings
The Raster editor settings button invokes Raster editor settings dialog.
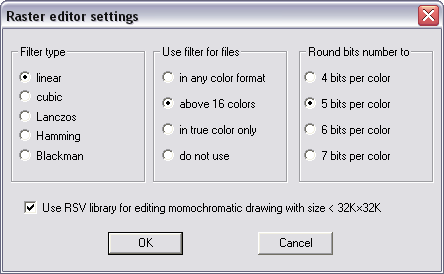
The available settings are grouped in three boxes:
Filter type Choice of filter type influences the way of calculating color of each pixel in transformed image during resizing, rotating and calibrating. The Linear and Cubic filters interpolate color value taking two or four adjacent pixels according to linear and cubic interpolation formulae, appropriately. The Lanczos, Hamming and Blackman filters take into account color values from six neighboring pixels. The default setting is Linear filter, which is the fastest one and precise enough for simple applications, like technical drawings and maps.
Use filters for files Although precise choice of filter type may be individual for each type of image, the general decision when to use filter and when to not filter at all may be taken basing on image color format. Option In any color format enables filtering always when transforming color and gray-scaled images. Option Above 16 colors enables filtering for color and gray-scaled 256-palette images as well as for true-color images. Option In true-color only limits filtering only to true-color images. Option Do not use disables filtering at all. The default setting is Above 16 colors.
Round bits number to When the palette image is to be transformed using filtering, it requires converting to true-color format for processing and converting result back while storing. Rounding 8 bits per each basic color to some lower value, e.g. 7, 6, 5 or 4 bits may shorten converting and processing time, with slight degradation of color precision. Successive options named 4 bits per color, 5 bits per color, 6 bits per color and 7 bits per color declare which rounding is to be used. The default setting is rounding to 6 bits per each basic color.
All settings chosen during editing session are stored in INI file. See http://tessel.com/for more details of the settings.
Default units
SuperEdit can display several raster and vector drawings at the same time. To place them in the common world system coordinates, the coordinates and distances related data have to be interpreted in a context of units they have been defined. Default file units support lets you set and store (in TAF files) default units for any opened drawing file that does not contain such information inside it. The units can be choosen from Default units combo-boxes in the Options - Configuration - Edit dialog. You can set units for:
a) background raster files,
b) backgroud vector files (vector drawings in DWG, DXF and HPGL format that SuperEdit with TSLETF option installed can display but not edit),
c) TCD (Tessel Composite Document) files,
d) DXF files, that can be imported/exported to/from current foreground TVD drawing).
Directory for temporary files
Path name to the disk directory where SuperEdit’s temporary files will be created.
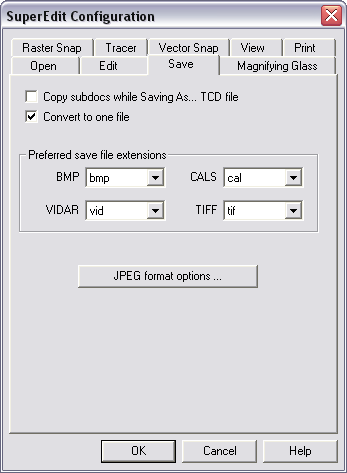
The Save tab allows you to defining the following options:
Copy subdocs while Saving As... TCD file
If this option is checked, SuperEdit saves not only TCD file with links to raster images or vector drawings, but also copy all subdocuments to new files. See the Save As... command description for more details. This option corresponds to the TCDSaveMode parameter in the [TSLRVC Library Settings] section in the supered.ini file.
Convert to one file
If this option is selected, SuperEdit creates the multi-page destination file while converting multiple input files.
Preferred file extension
Some raster formats may be saved under different file extensions. These include Vidar, CALS Bitmap and TIFF. You can define preferred extension for each format.
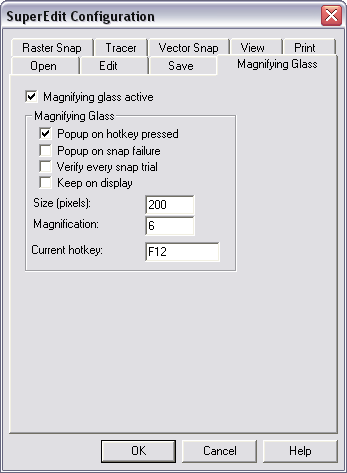
The Magnifying Glass tab allows you to configure the Magnifying Glass tool. Checking Magnifying Glass active box activates the function. The Magnifying Glass window displays a zoomed area around the position of the mouse pointer when the Magnifying Glass is activated. Using a hot key, you can activate Magnifying Glass even in the course of a command defining process, especially when the next point is expected. If raster snap was active and successful, its result will be indicated by a cross symbol. If the snap result is not satisfactory, you may pick a new point precisely. The Keep on display option controls the method of closing the Magnifying Glass window. If option is not selected the Magnifying Glass window is closed automatically if you move the mouse cursor outside the window or you pick a new point inside the window. Otherwise, the Magnifying Glass window disappears after pressing the Esc key or right mouse click. The Esc key cancels the point in the Magnifying Glass window. The right mouse click accepts the point and passes its coordinates to SuperEdit command.
There are several methods of using the Magnifying Glass:
Popup on hot key pressed
Magnifying Glass window will be displayed after pressing the configured hot key
Popup on snap failure
Magnifying Glass window will be displayed if you tried to snap to raster and no snap point was found. This option is very useful with bad quality raster images that have jagged lines, many gaps, etc., that cause frequent raster snap failures
Verify every snap trial
Magnifying Glass window will be displayed after every raster snap trial, both unsuccessful and successful, to verify and/or correct its result
Keep on display
Magnifying Glass window will be closed after pressing the Esc key, which cancels the point, or right mouse click, which accepts the point.
Other parameters on the Magnifying Glass tab allow the user to customize the Magnifying Glass window size in pixels and the magnification scale of raster. Current hot key may be changed simply by deleting its description from its box and pressing a new key (or combination).
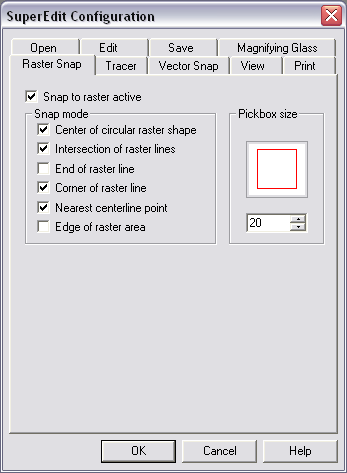
The Raster Snap tab allows you to configure the Raster snap feature.
If the Snap to raster active option is checked, SuperEdit is put into continuous snap mode. Every click in the drawing window is passed to SuperEdit that searches for the best possible raster point that matches specified snap modes. You may snap to the center of circular raster shape, to intersection of raster lines, to the end of raster line, corner of raster line, to the nearest point on the centerline or to the edge of raster area. Raster Snap modes may be selected (and combined, if necessary) by checking their boxes in the dialog.
When multiple Snap modes are selected, SuperEdit attempts to detect the relevant features of raster images according to the following hierarchy that corresponds to the order of the snap mode options shown in the dialog:
Snap to center of circular raster shape;
Snap to intersection;
Snap to line end;
Snap to line corner;
Snap to centerline;
Snap to edge of raster area.
If, for example, both raster line corner and intersection are detected within the snap pickbox area, the point of intersection, that is higher in the hierarchy, will be returned.
SuperEdit activates a pickbox to show the area where to look for a snap point. Depending on raster image contents and zoom level the user should chose a convenient pickbox size.
Snap modes that you choose with Snap tab set the modes for single click; snaps that are activated from the Options and tools Menu (OTM), either.
You can use the Raster Snap toolbar as the other way to choose and set preferred permanent and single click raster snaps. The state of Snap tab options is stored in supered.ini file and defines the initial state of them.
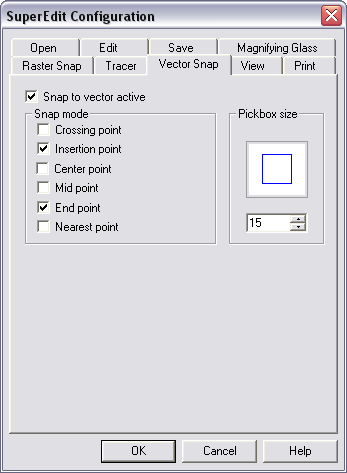
The Vector Snap tab allows you to configure the Vector snap feature.
If the Snap to vector active option is checked, SuperEdit is put into continuous snap mode. Every click in the drawing window is passed to SuperEdit that searches for the best possible raster point that matches specified snap modes. You may snap to the center of circular raster shape, to intersection of raster lines, to the end of raster line, corner of raster line, to the nearest point on the centerline or to the edge of raster area. Raster Snap modes may be selected (and combined, if necessary) by checking their boxes in the dialog.
When multiple Snap modes are selected, SuperEdit attempts to detect the relevant features of raster images according to the following hierarchy that corresponds to the order of the snap mode options shown in the dialog:
Snap to cross of vector elements;
Snap to intersection point;
Snap to geometrical center;
Snap to midpoint;
Snap to endpoint;
Snap to nearest point.
If, for example, both intersection and endpoint are detected within the vector snap pickbox area, the point of intersection, that is higher in the hierarchy, will be returned.
After activating vector snap, a blue pickbox is displayed together with drawing cursor (the pickbox concerned with raster snap is red). After successful vector snap, a small blue circle is displayed in the snapped position (after successful raster snap, the snapped position is marked as small red cross). Depending on raster image contents and zoom level the user should chose a convenient pickbox size.
Snap modes that you choose with Snap tab set the modes for single click; snaps that are activated from the Options and tools Menu (OTM), either.
You can use the Vector Snap toolbar as the other way to choose and set preferred permanent and single click vector snaps. The state of Vector Snap tab options is stored in supered.ini file and defines the initial state of them.
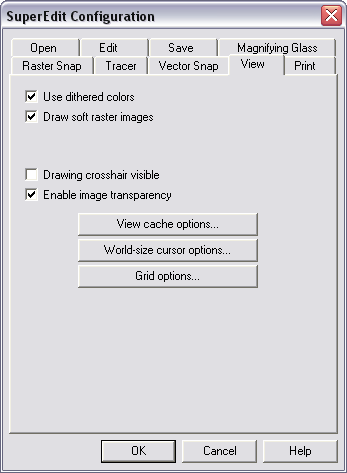
The View tab allows you to define view options:
Use dithered colors
If this option is checked, SuperEdit uses dithering to improve image colors mapping. The option is especially useful when displaying images with many colors on display devices with only 16 or 256 physical colors. This option corresponds to the DitherMode parameter in the [TSLRVC Library Settings] section in the supered.ini file.
Draw soft raster images
During diplaying process, a new proprietary technology called ClearView has been introduced. It gives maximal readability of raster images being displayed, specially when they are presented in screen resolution lower than original image resolution, e.g. during zoom-out.
In case of monochromatic images, this technology additionally applies adaptive shaping of gray-scaling curve, thus giving optimal readability independently from image contents and viewing scale.
In case of color images, readability of image details and clarity of image colors have been greatly enhanced. In case of palette drawings, ClearView eliminates false artifacts observed so far. You may want to switch the ClearView feature off to speed-up redisplaying process.
Drawing crosshair visible
Use the option to display crosshair that can help you defining commands and vector entities.
Enable image transparency
This option is responsible for switching on or off the usage of transparency information defined in a raster image.
View cache options
The View cache options button invoke configuration dialogs of SuperEdit’s integrated view and print cache. All modified parameters are stored in the supered.ini file. More information about modified property is specified in the section called “SUPERED.INI file”.
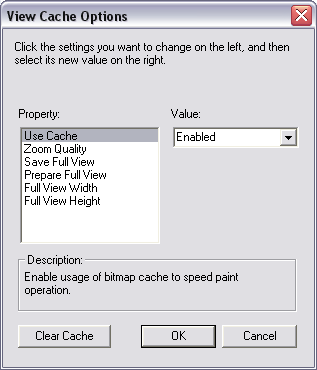
World-size cursor options
SuperEdit supports displaying cursor which size is constant in world coordinates. Use the option to invoke World-size cursor settings dialog and define cursor size and switch it on or off. World-size cursor is not available in the Print Preview state.
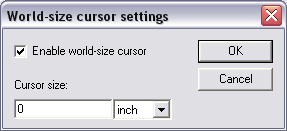
Grid options
It is possible now to display grid in the Drawing window. The grid size may be set independently in x and y directions, defined in user-preferred units, and the grid itself may be activated from separate dialog after pushing Grid options button from View page on the Configuration dialog. Grid nodes are displayed as dots, with major grid lines enhanced. If the grid is too dense to display, some of its nodes are omitted. You may easily switch the grid on and off using the Grid button on main toolbar, placed together with Crosshair and World-size cursor buttons.
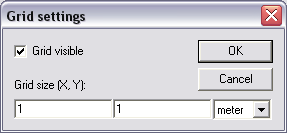
You may activate snap to grid in drawing operations, using new Grid snap button placed on the Input bar, or hit F9 key. Similarly, you may activate orthogonal snap, using Ortho snap button placed on the Input bar, or hit F8 key. Both F8 and F9 keys are used as toggles.

The Tracer tab allows you to define the following options:
Use raster line widths
If checked, a traced polyline will have a width that matches the raster line width. If the option is not checked, the traced polyline width will be set to value declared in the Line width edit box. This option corresponds to the UseTraceWidths parameter in the [Raster Snap Options] section in the supered.ini file.
Curve param
Available values are 1...32. The option says how precise to estimate raster line curvature. Smaller values give better precision. This option corresponds to the CurvePar parameter in the [Raster Snap Options] section in the supered.ini file.
Segment param
Available values are 1...32. The option defines minimal segment length in pixels. Smaller values allow shorter minimal segments to be used for tracing. This option corresponds to the SegmentPar parameter in the [Raster Snap Options] section in the supered.ini file.
Line width
Defines the uniform width of traced lines. This option corresponds to the TraceWidth parameter in the [Raster Snap Options] section in the supered.ini file.

The Print tab allows you to define the following options:
Use image colors when printing
If this option is checked, SuperEdit uses the original image colors while printing. If the option is not checked, the images are printed as if they were black. This option corresponds to the PrintColors parameter in the [TSLPPL Library Settings] section in the supered.ini file.
Print cache options...
The Print cache options... button invokes configuration dialogs of SuperEdit’s integrated print cache. All modified parameters are stored in the supered.ini file. More information about modified property is specified in the section called “SUPERED.INI file”.
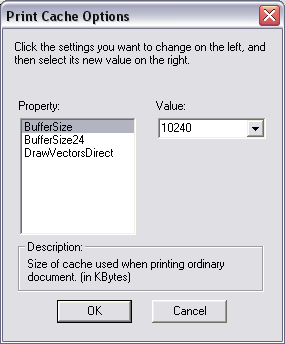
Publish HTML options...
The Publish HTML options... button invokes Publish HTML Setup dialog. Use it to define HTML preview template file. Define Print resolution and Preview resolution (in dpi) according to your requirements (see paragraph Printing (publishing) in HTML format for details).
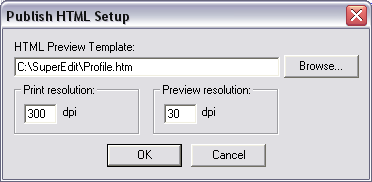
Printing template
A printing template is the vector drawing that defines document localization on the paper sheet and may contain a standard border definition. SuperEdit package contains a separate utility called Template Editor for preparing printing template drawings. The Template Editor is described in appendix. Template Editor allows you to define a standard frame for printing documents in Portrait and Landscape orientations. If you don’t define default print template, SuperEdit fits the document to the paper sheet on the current system printer.
Browse
Use the option to select TVD drawing with a print template that is previously defined by Template Editor. The Select printing template file dialog is displayed (it is the standard Open dialog with TVD as predefined file type). The template selected is used for subsequent Print Preview and Print options.
Reset
If you want to print a document without the previously selected print template, use the Reset option. Then SuperEdit fits the document to the paper sheet on the current system printer.
While editing color image there is a need to specify which color should be used to fill the cleared raster areas. The intuitive white is not necessarily a good choice for most color images. Using this command, you can pick the best fill color in the image.
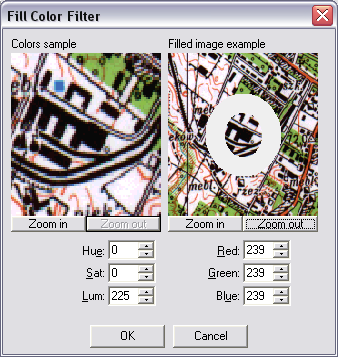
First, you pick a point on raster image where the color sample will be taken from. You may use the Snap tab of the Configuration dialog to change the pickbox size, if you wish. After clicking a point, the Fill Color dialog will appear on the screen.
The Colors sample window on the left side displays the chosen raster sample. The Filled image example window on the right shows a view of the raster image around the pick point, with a collar in selected color drawn on it. The collar is to help you to match raster image background with selected fill color.
You can modify Fill Color value (that consists of discrete color’s RGB values) by entering RGB or HSL parameters.
In Clear Rectangles / Polygons operations, the fill color fills the area defined for clearing. Similar “clearing to fill color” is done during Cut Rectangle / Polygon operations.
In Crop Rectangle / Polygon operations, the fill color is used to paint redefined parts of raster image. Similar “completing by fill color” is done during Cut / Copy Rectangle / Polygon, regarding exported part of image.
In Rotate / Calibrate Drawing operations, the fill color is used to paint undefined parts of raster image, that complete transformed shape of original image to the extent of new image.
In Paste Drawing operation, the fill color similarly completes redefined image extent if the pasted drawing exceeds it. However, the most important use of fill color during pasting is its interpretation in image being pasted. All parts of this image that have the same color as the fill color are treated as if they were transparent. It enables to handle properly such situations as pasting complicated raster shapes obtained in Cut / Copy Polygon operation, even after resizing and rotating pasted drawing.
The default fill color is white. You may have to redefine it to some other color that is not involved in Cut / Copy / Paste operations, to obtain proper results.
While snapping to selected features of color raster images SuperEdit uses color filtering tool, called Color Range Mask, to pre-define the set of colors that belong to the objects being snapped to.
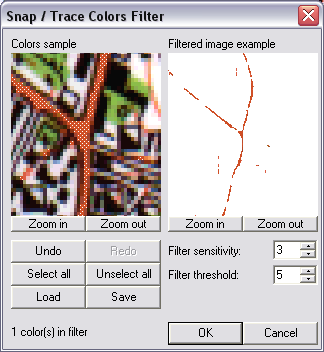
First, you pick a point on raster image where the color sample will be taken from. You may use the Snap tab of the Configuration dialog to change the pickbox size, if you wish. After clicking a point, the Snap Colors Filter dialog will appear on the screen.
The Colors sample window on the left side displays the chosen raster sample, while the Filtered image example window on the right shows a filtered view of the raster image around the pick point.
You define Color Range Mask (that consists of discrete color’s RGB values) by clicking pixels in the Colors sample window. When you pick a new color, it is added to the mask and all its pixels are marked. When you pick a previously selected color (marked pixel) it is removed from the mask. You may also use the Undo / Redo and Select / Unselect all buttons to control this process. The number of colors currently in the mask is shown at the bottom of the dialog.
The Filtered image example window shows only those parts of the raster image that will be ‘seen’ by the SuperEdit’s snapping utility. You may click inside the window to display the corresponding B&W raster image instead of its color original.
The process of image filtering is additionally controlled by two parameters:
filter sensitivity
the range of this parameter is 0...255, default is preset to 2;
filter threshold
the range of this parameter is -128...+128, default is preset to 0.
You may try different values to check their influence on the image filtering results.
Color filter definitions may be saved and loaded from named files using the appropriate buttons.
The raster editing library enhances use of fill color and image transparency concepts, used in advanced image processing applications.
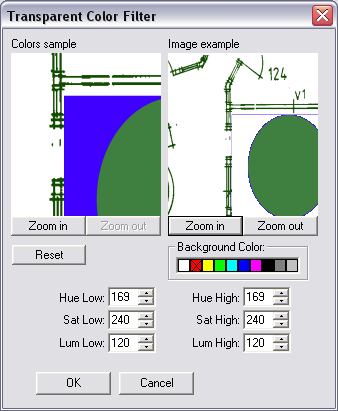
The set of transparent colors defined from the Transparent Color Filter dialog enables to define and modify selective transparent areas using Transparent Clear Rectangles / Polygons and Transparent Mask – Invert / Remove operations.
Transparent masks introduced in color drawing are now transformed properly in Resize / Rotate / Calibrate operations and preserved in Cut / Copy / Paste operations.
In Paste Drawing operation, interpretation of image transparency in drawing being pasted depends on the setting of Enable image transparency option from the View tab on Configuration dialog. Those areas of pasted drawing that have been defined as transparent ones, are not pasted to current drawing if the Enable image transparency option is on. Otherwise, the whole drawing (excluding areas of color equal to fill color – see previous section) is pasted, ignoring transparent mask.
The Scan parameters... command launches a dialog box for setting technical parameters of the scanning process. This dialog box depends on the current scanner type and is displayed and managed by its driver. The parameters are specific for the particular type of the scanner that is currently used. After setting parameter values, one must initialize the scanning process.
NOTE: Saving the parameter values is done during scanning. That is why, in order to save parameters, one must perform “dummy” scanning - it is not enough just to set the parameters up.

For users wanting customize SuperEdit to face their own purposes there is a possibility to write and execute macros.
More information about SuperEdit's programming interface and macros usage you can find in "SuperEdit Customization Manual". This document and sample macro files you can find in the Macros subdirectory of SuperEdit directory.

The same Geographical Mapping entry with its sub-menu is appended to the OTM and DWM pop-ups as well. The OTM Geographical Mapping sub-menu is checked when some geographical mapping is active. The sub-menu of the Geographical Mapping option consists of the items described below.
0 None - If the 0 None option is set, SuperEdit does not use geographical mapping at all. The check mark placed at the None option indicates that no mapping is active. The coordinate system and units used in this case are determined by settings of the coordinate system and presentation units combo boxes on the Input bar;
1, 2, 3, 4 Recent - Use Recent option to select one of the geographical mapping systems recently used. Names of these mappings are listed on subsequent items of sub-menu. The check mark placed at the mapping name indicates that this mapping is active. SuperEdit remembers up to four mappings. They are numbered from one up to four (zero is reserved to None mapping option item). The order of mapping system sequence on the sub-menu matches the selection history. The absence of Recent items suggests that geographical mapping has not been used in the configuration taken from the supered.ini file. The check mark placed at the mapping name indicates that this mapping is active. The names and the order of mappings are saved in the supered.ini configuration file and set automatically after starting the application again;
Select... - Use Select...option to set the current geographical mapping system. After entering the option, the Geographical Mapping dialog is displayed. The chosen mapping becomes the current one. It means that all entered, displayed and edited coordinates are interpreted using the current mapping. Its name is displayed on sub-menu as Recent mapping item and checked.
The Geographical Mapping dialog consists of the listbox with names of geographical mapping systems supported by TSLGEO32.DLL (see the section called “Appendices”. The name and description of selected mapping are displayed in Mapping Name and Mapping Description boxes.

Activate Parameters... button to set parameters of selected mapping by means of additional dialog box. A content of the dialog depends on the mapping. The button is disabled if the chosen system is not configurable (it has no changeable parameters).
Use OK button to accept the selected mapping and close the dialog. Use Cancel button to withdraw changes made (if any) and close the dialog.
Information about geographical mapping to be used while viewing raster drawing, can be stored in and retrieved from Tessel Attribute File (*.TAF file).
You may examine contents of "Options - Geographical Mapping - Load" option to check geocoding info associated with raster drawing, and activate this option to force the mapping to be active. Alternatively, you may select some mapping and choose "Options - Geographical Mapping - Save" option to associate it with the drawing.
Both options are enabled only if there is only one raster drawing opened, or (in case of composite documents containing several raster drawings) only one raster drawing selected.
The same geocoding information, together with georeferencing data, are stored and retrieved in GeoTIFF format in TIFF drawing files and in MapInfo (MIF) format in *.TAB files (if selected after activating "Options - Configuration - Open tab - Parameters file options" button).
Possibility of retrieving geocoding information stored in GeoTIFF or MapInfo format is limited to geographical mappings implemented in TSLGEO dynamic link library.
The purpose of the Window menu commands is to change the layout of open document windows. The second part of this menu displays a list of open document names. These names are equivalent to document window names, which allows selecting a new current (active) window. The current window is marked in the menu with a check marker.
The New Window command opens a new window for the current document. The next ordinal number of the window (opened with the same composite document as the previous current window) is displayed on the title bar of this window, on the right side of the file name(s).
When more than one document window is open, the Tile (Horizontally) command divides the whole SuperEdit main window between all equally sized document windows. When just one document is open, its window is expanded to fill the entire SuperEdit drawing window.
After issuing this command, all document windows are arranged in such a way, that each is visible and does not overlap with any of the other windows and the neighboring windows have common horizontal borders.
When more than one document window is open, the Cascade command arranges open document windows in form of stack. They overlap each other but each is shifted a little, so that their title bars are visible. The current document window remains active and is placed on the top of the stack.
When just one document is open, its window is expanded to fill the entire SuperEdit drawing window.
Every document window can be minimized to a form of a SuperEdit icon labeled with a document name. The names of minimized windows (documents) remain present on the list of open documents in the Window menu.
These icons can be dragged with the mouse one by one to a new place. The Arrange Icons command changes the placement of these icons. It puts them in a row(s) at the bottom of the drawing SuperEdit window. When you double click with a mouse on a document icon or click on a document name on the list in the Window menu, the selected document window opens again at the previous place and size. The Arrange Icons command does not move open windows, so they may overlap the area, where document icons are placed. In such a situation, you can uncover the icons by resizing the windows manually or with the Cascade command.